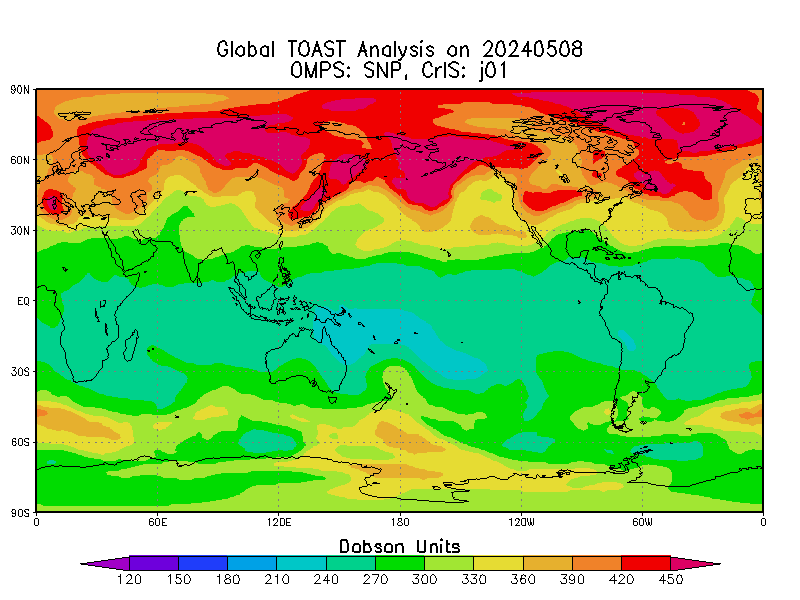
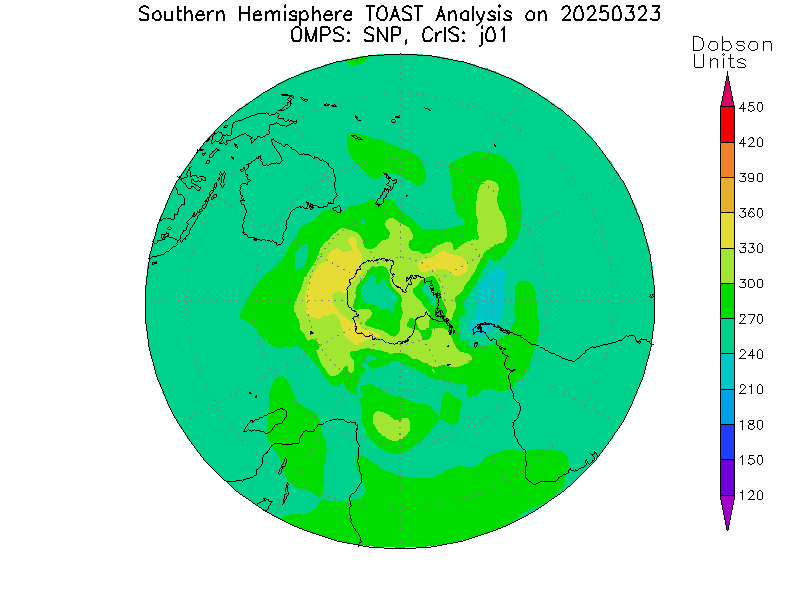
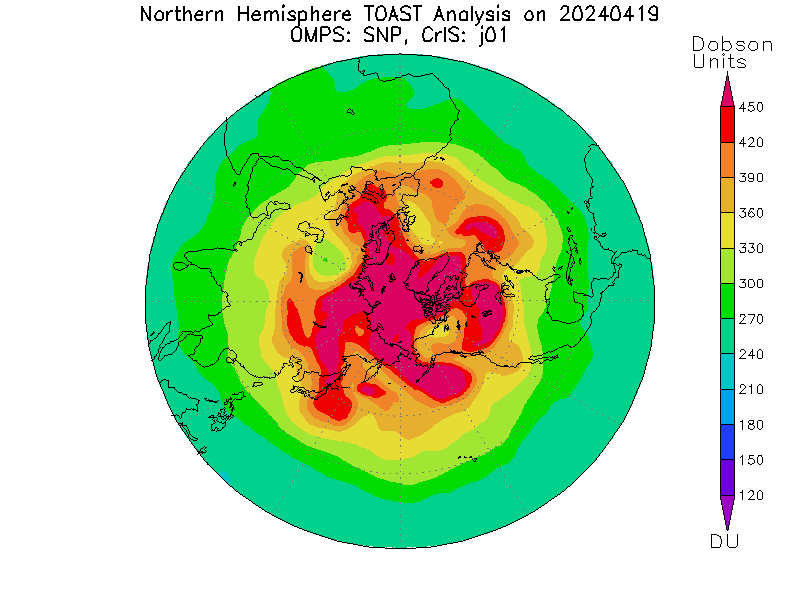
Total Ozone Analysis Using OMPS and CrIS
This algorithm is a new generation of the current operational TOAST. It replaces data from the sensors, used to compose the TOAST (SBUV/2 and HIRS) with the most newly developed sensors: OMPS NP and CrIS. This leads to improve the product accuracy and provide continuity of TOAST contributions to the ozone researchers and other users. This new algorithm has been developed as the legacy of the TOAST. Instead of estimating the UTLS ozone by HIRS provided total amount retrieval, a full troposphere and lower stratosphere (FTLS) ozone has been accurately derived based on the fine height resolution profile retrieved from CrIS hyper-spectral observation. The mid-to-upper stratosphere (MSUS) ozone has been analyzed using the new generation ozone profiler OMPS NP to replace the SBUV/2. Following information has been provided by Jianguo Niu (STAR):
The CrIS instrument on S-NPP [Han, Y. 2013] is a major step forward in the U.S. operational IR sounding capability previously provided by the HIRS instruments of the TIROS-N TOVS series. CrIS obtains good daily spatial coverage by using a cross-track scan mirror to cover a 2200-km wide swath with 30 earth-scene fields-of-regard (FOR). Each FOR consists of 9 fields-of-views (FOVs), aggregated into a 3x3 array of 14 km diameter spots in the nadir. CrIS is a plane mirror Michelson interferometer Fourier transform spectrometer, providing a spectral resolution of 0.625 cm-1 at the long-wave IR (LWIR) band from 650 to 1095 cm-1 which includes the ozone absorption band around 1040 cm-1. One CrIS EDR granule contains four cross-track swaths of 120 observations (i.e. 2700 granules/day); the same orbits per day number as OMPS NP provides full global coverage. Unlike the HIRS retrieval product used in the current TOAST, CrIS retrieves not only ozone total amount but also a 100-layer ozone profile. This significant instrument improvement provides us more accurate ozone information within UTLS than that former TOAST HIRS provides. The basic consideration of TOAST products is to utilize the properties of IR measurements’ sensitivity to the ozone distribution in the lower atmosphere, and of UV measurements’ sensitivity to the ozone distribution in the upper atmosphere. The total amounts of ozone are a combination of the FTLS ozone and the MSUS ozone retrieved from CrIS IR observations, and from OMPS NP UV observations, respectively.
To combine the two sensors, the profile pressure scale of CrIS need to be converted into the OMPS NP scale, then a series of coordinate transformation need to be conducted from geographic into stereographic coordinate before carrying out the objective analysis. The objective analysis in this study is to improve an initially assumed global ozone distribution (the first guess) by incorporating the currently available satellite measurements. At last, this analyzed global ozone data are transformed back to the original geographic coordinate with resolution of 1 by 1 degree. The Ozone team continually monitors the performance of the various SBUV/2, OMPS and CrIS instruments and will vary the combination used in the distributed TOAST product to provide the best quality product. |
Enhanced Total OzoneNTOAST: Latest NTOAST: Previous Week OMPS: Previous Week CrIS: Previous Week CrIS: Latest CrIS: Previous Week OMPS: Previous Week Ozone Hole Area
|