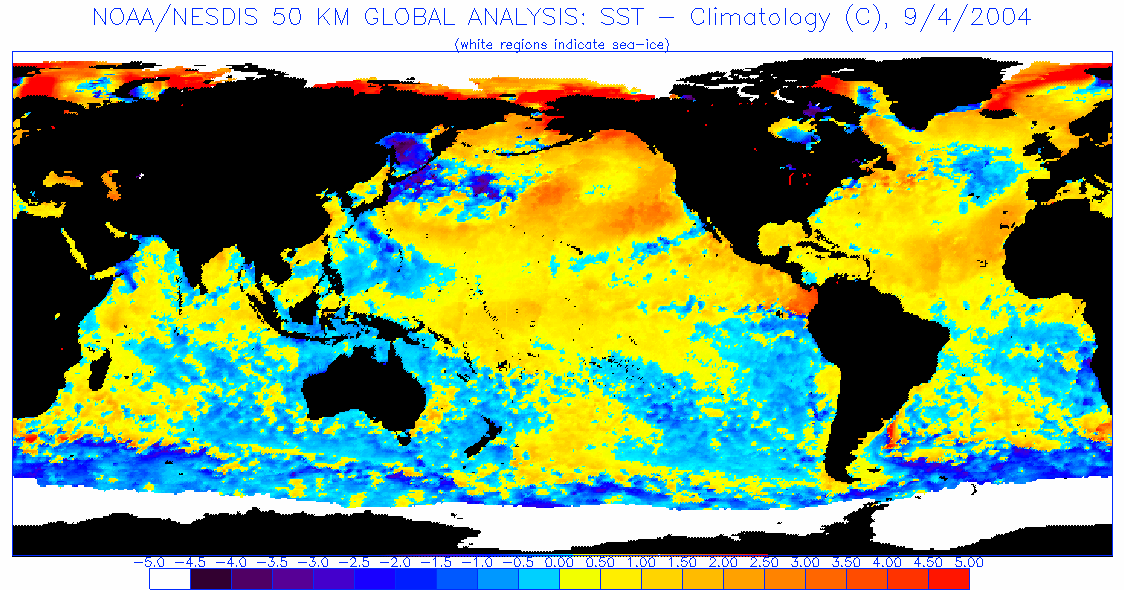
For information about these images, go to the methodology webpage.
January | 3 | 5 | 10 | 13 | 17 | 20 | 23 | 27 | 31 |
February | 3 | 7 | 9 | 14 | 17 | 21 | 24 | 27 | |
March | 2 | 6 | 8 | 13 | 16 | 20 | 23 | 26 | 30 |
April | 3 | 6 | 10 | 12 | 17 | 20 | 24 | 27 | |
May | 1 | 4 | 8 | 11 | 15 | 17 | 22 | 25 | 29 |
June | 1 | 5 | 8 | 12 | 15 | 19 | 22 | 26 | 29 |
July | 3 | 6 | 10 | 13 | 17 | 20 | 24 | 27 | 31 |
August | 3 | 7 | 10 | 14 | 17 | 21 | 24 | 28 | 31 |
September | 4 | 7 | 11 | 14 | 18 | 21 | 25 | 27 | |
October | 1 | 5 | 9 | 12 | 16 | 19 | 22 | 26 | 30 |
November | 2 | 6 | 8 | 13 | 16 | 20 | 23 | 27 | 30 |
December | 4 | 7 | 11 | 14 | 18 | 21 | 25 | 28 |
Anomalies | |||||
---|---|---|---|---|---|
1996 | 1997 | 1998 | 1999 | 2000 | 2001 |
2002 | 2003 | 2004 | 2005 | 2006 | 2007 |
2008 | 2009 | 2010 | 2011 | 2012 | 2013 |
2014 | 2015 | 2016 | 2017 | 2018 | 2019 |
Regularly Updated Operational Coral Bleaching Monitoring Products: | Retrospective Coral Bleaching Monitoring Products: | Other Links of Interest: |
50 km Nighttime SST SST Anomalies HotSpots Degree Heating Weeks Bleaching Alert Area Coral Bleaching Virtual Stations Satellite Bleaching Alerts |
1984-1998 SST monthly means 1984-1998 SST monthly mean Anomalies 1998/1999 seasonal DHWs |
Ocean Surface Winds STAR Satellite Oceanography Division Comprehensive Large Array-data Stewardship System National Climatic Data Center Polar Orbiter Data and NOAA KLM User's Guides |