Sea Surface Temperature

SST Anomaly Charts

SST Anomaly Charts

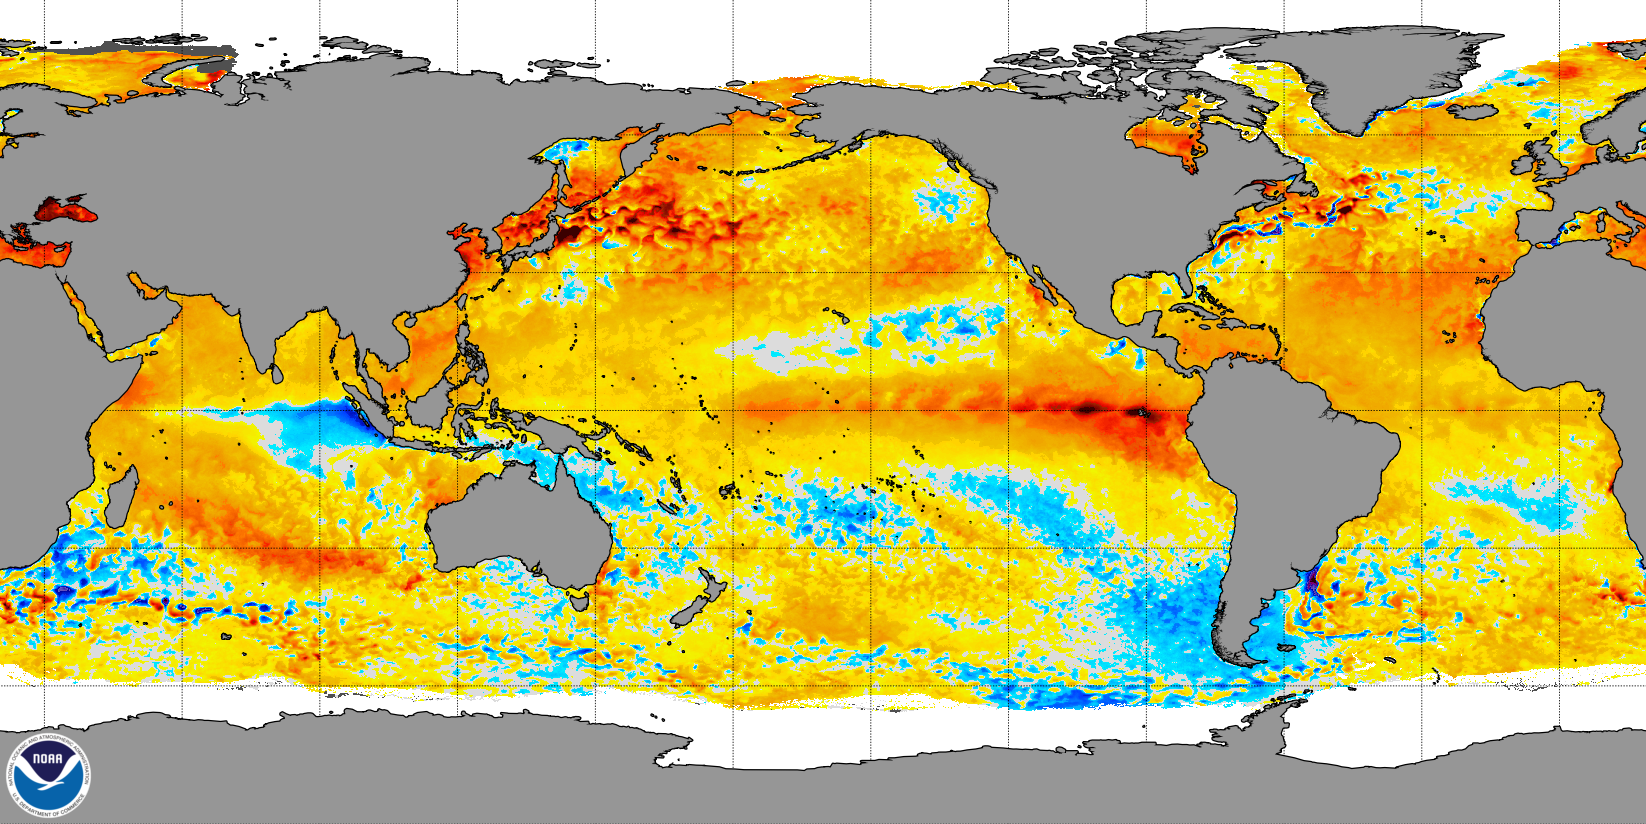
The global 5km Sea Surface Temperature (SST) Anomaly product shows the variance between today's SST and the long-term average. It employs a scale ranging from -5 to +5 °C. Positive values indicate warmer-than-average temperatures, while negative values signify cooler-than-average conditions.

POES & GOES | Resolution: 5km | Frequency: Daily

SST Contour Charts

SST Contour Charts

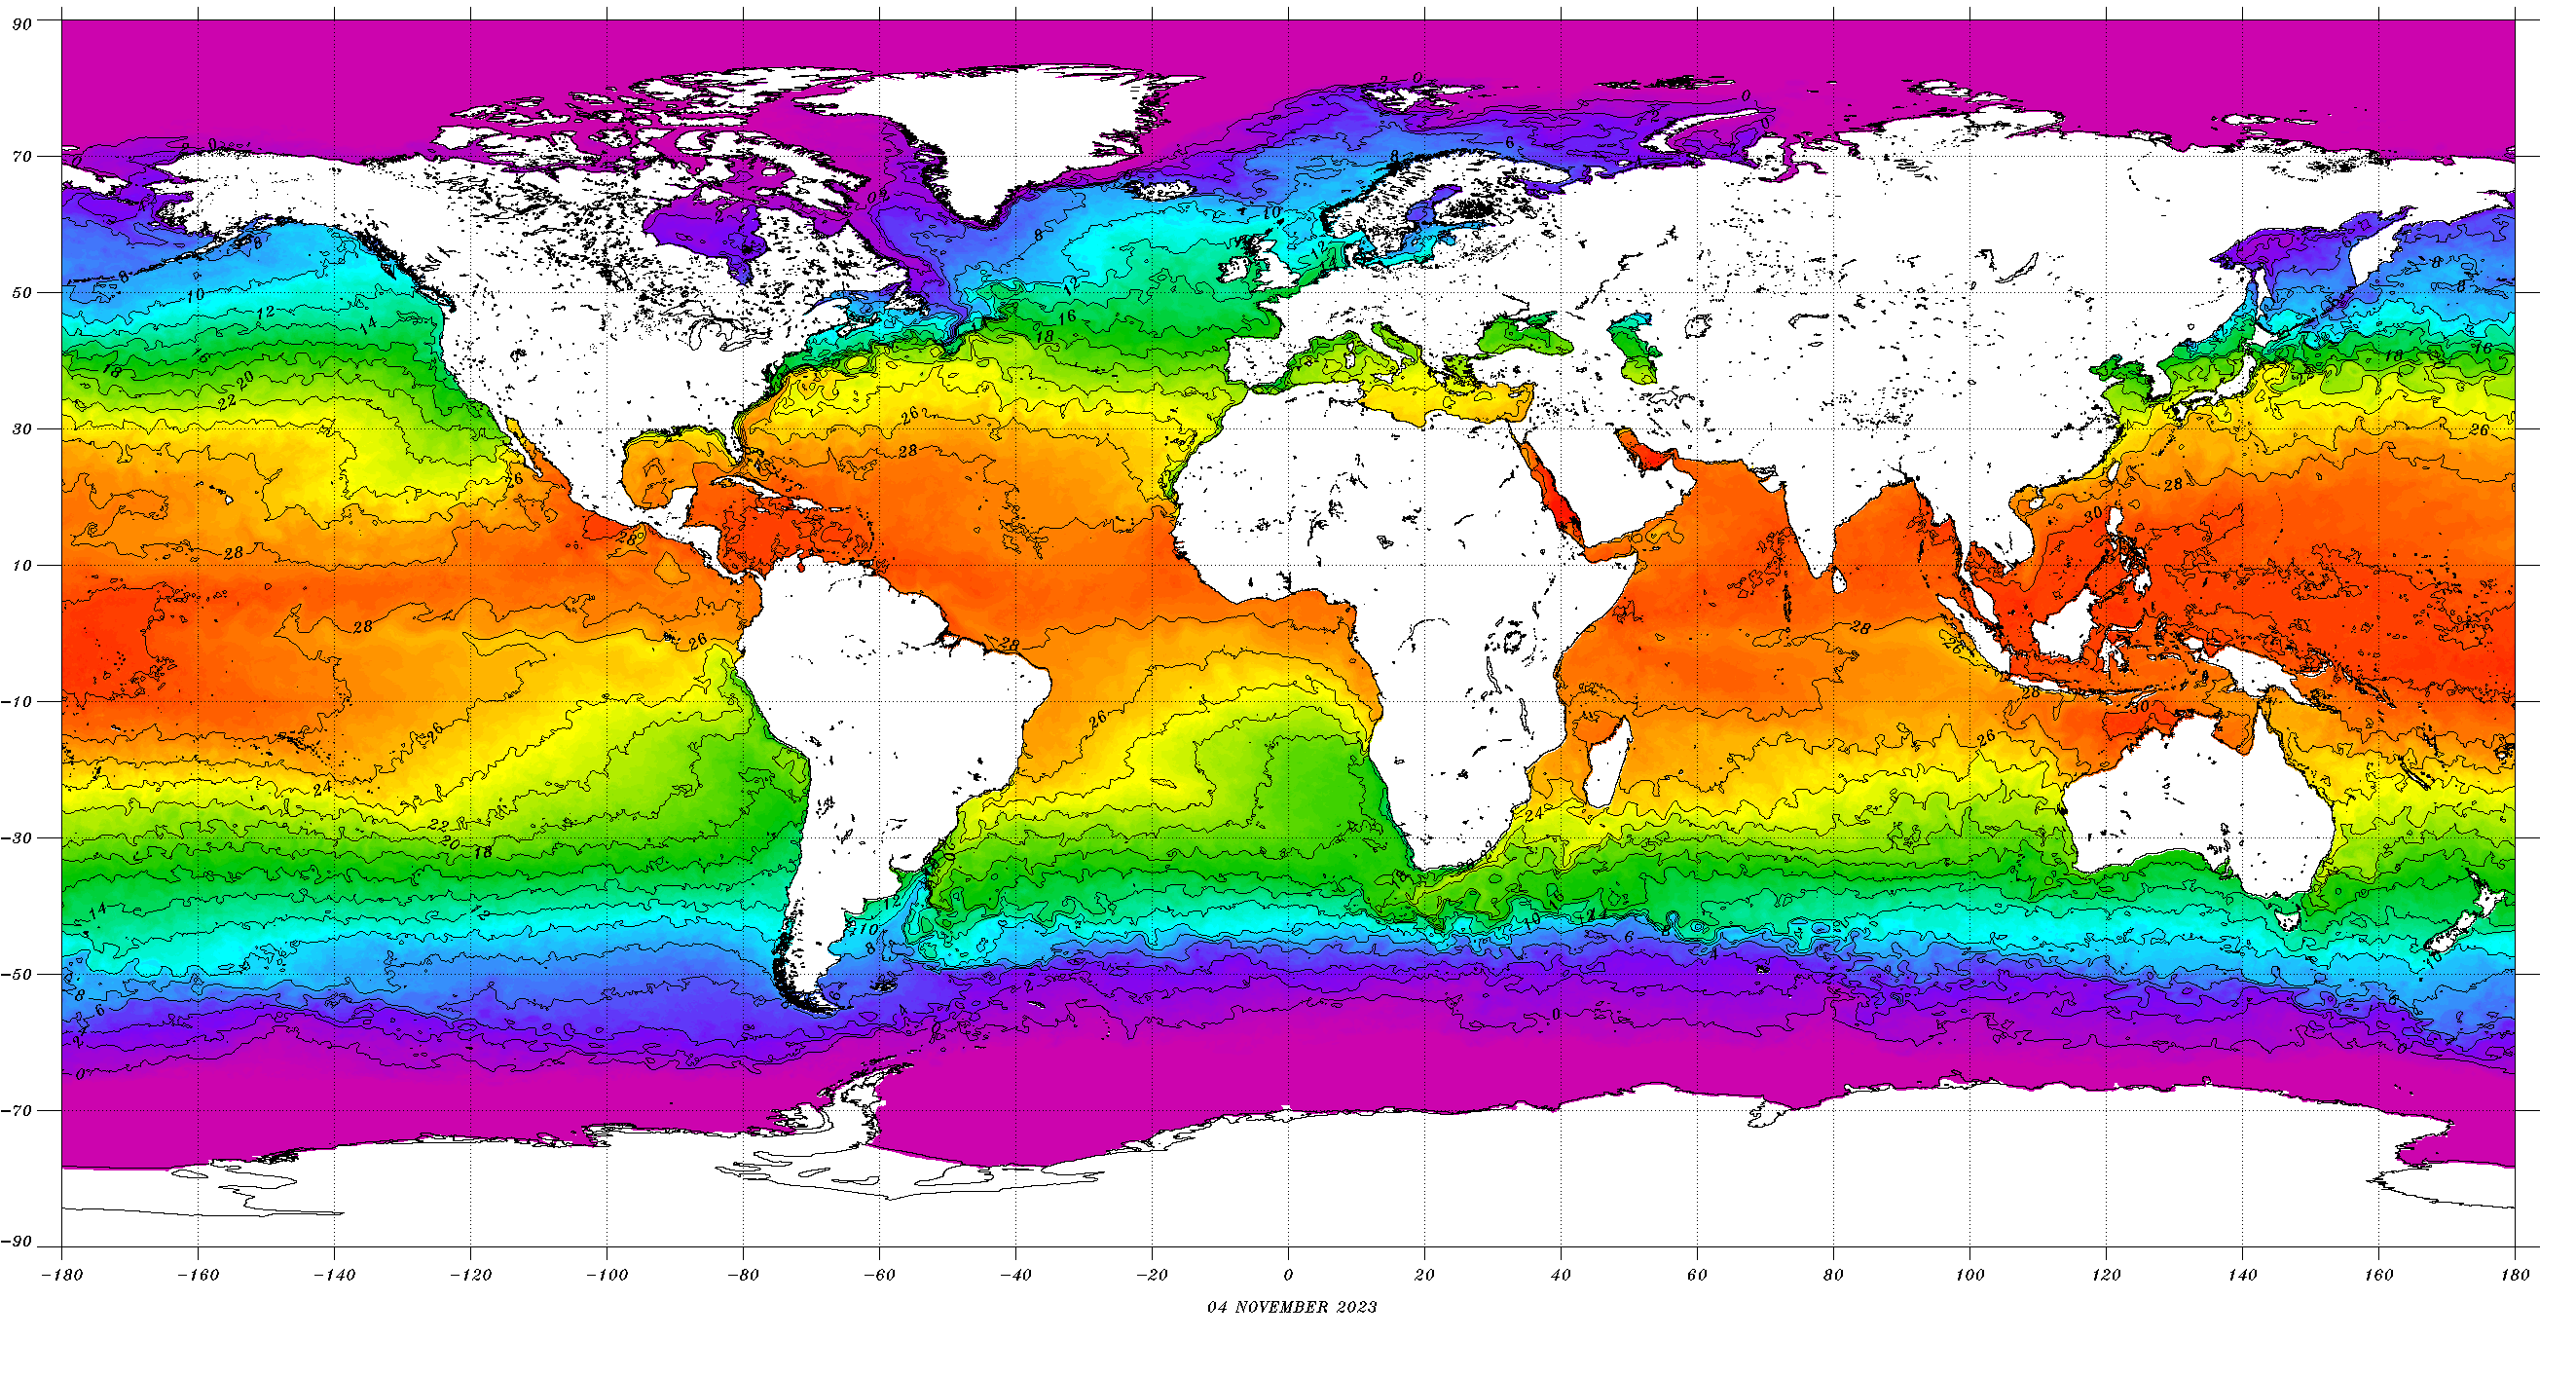
Contour charts visually represent gridded Sea Surface Temperature (SST) products. These charts display SST values using contour lines and can depict both global and regional data with various grid spacing.

POES & GOES | Resolution: 5Km | Frequency: Daily

SST Nighttime Field Image Charts

SST Nighttime Field Image Charts

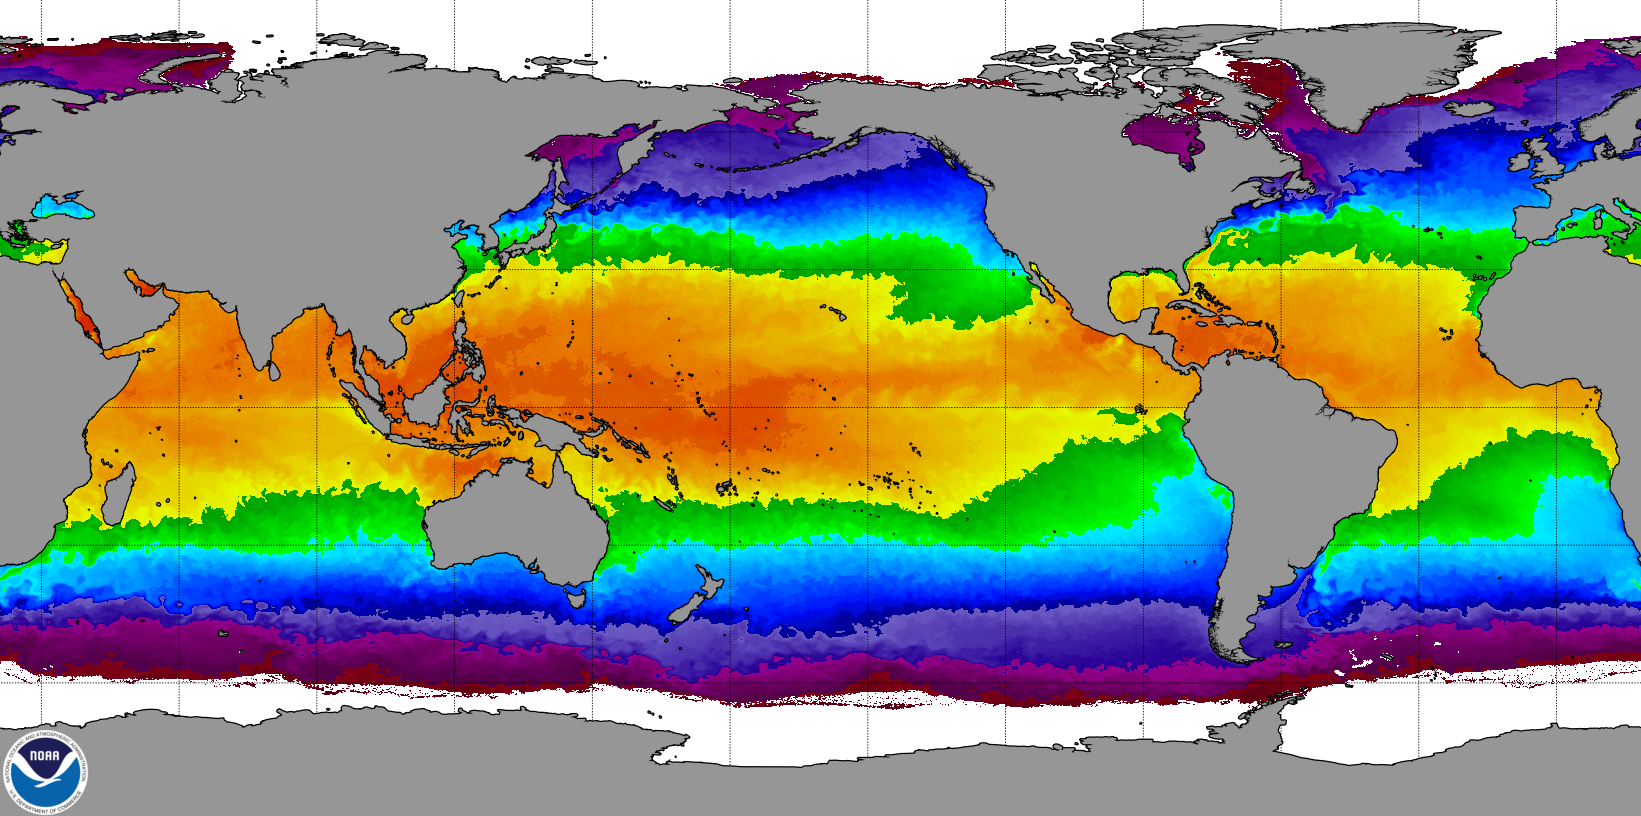
The operational night-only SST analysis is at a resolution of 50 km and is used to produce the SST anomaly charts.

POES & GOES | Resolution: 5Km | Frequency: Daily

SST Swaths

SST Swaths

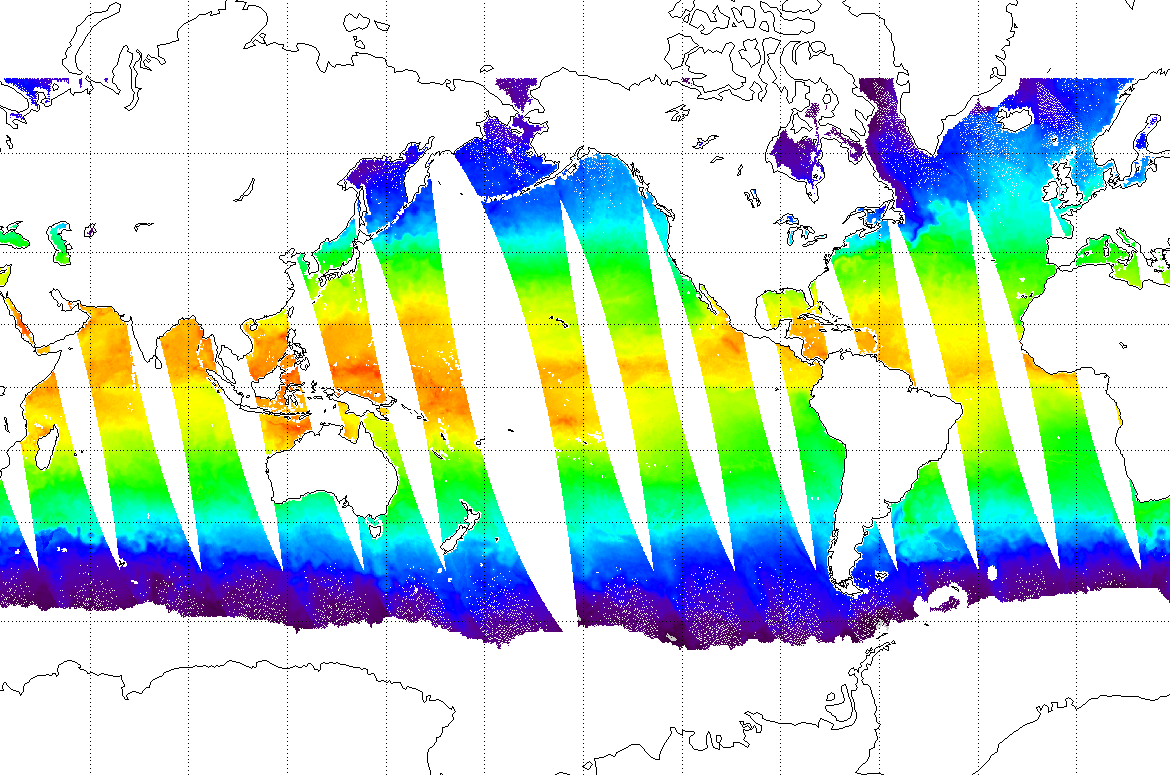
The AVHRR-and-VIIRS CoastWatch SST products provide users with operational satellite data processed using TeraScan software and CoastWatch utilities.

POES & GOES | Resolution: 5Km | Frequency: Daily

AMSR-2 SST Data

AMSR-2 SST Data

Satellite Sea Surface Temperature from AMSR-2 (Advanced Microwave Scanning Radiometer 2) instrument aboard the Japanese Aerospace Exploration Agency (JAXA) Global Change Observations Mission for Water (GCOM-W). GCOM-W1 AMSR2 Algorithm Software Package (GAASP).

POES & GOES | Resolution: 5Km | Frequency: Daily