Images of Hurricane Wilma
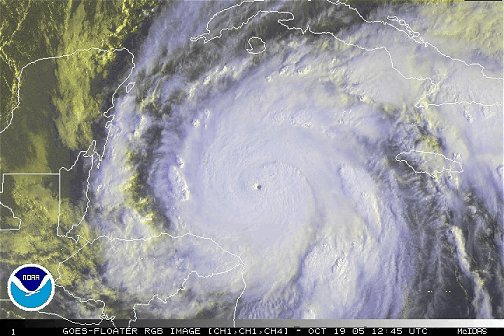
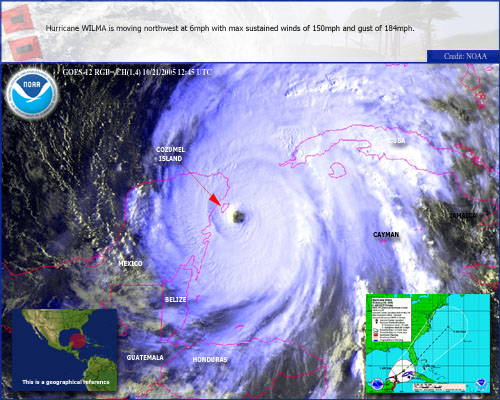
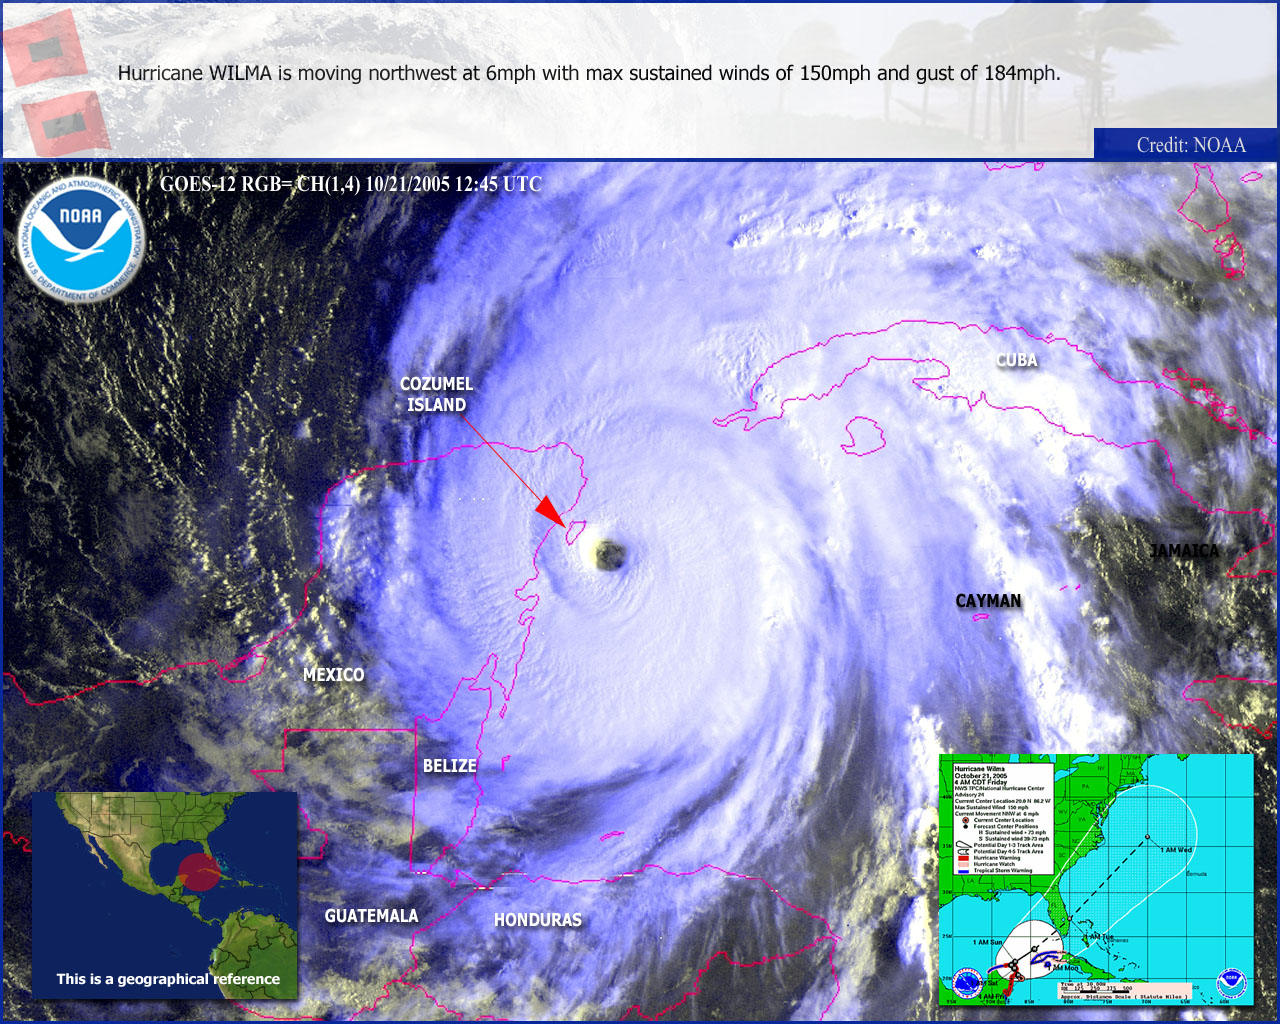
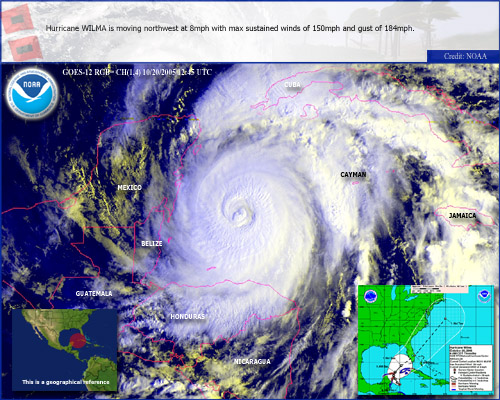
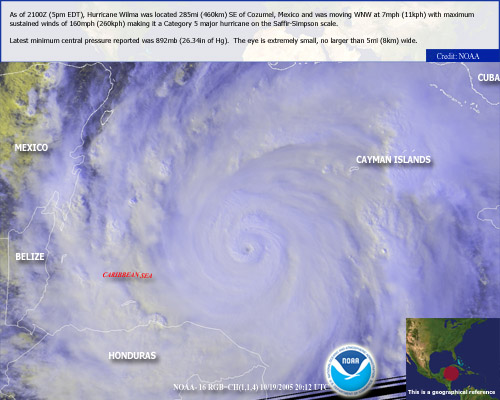
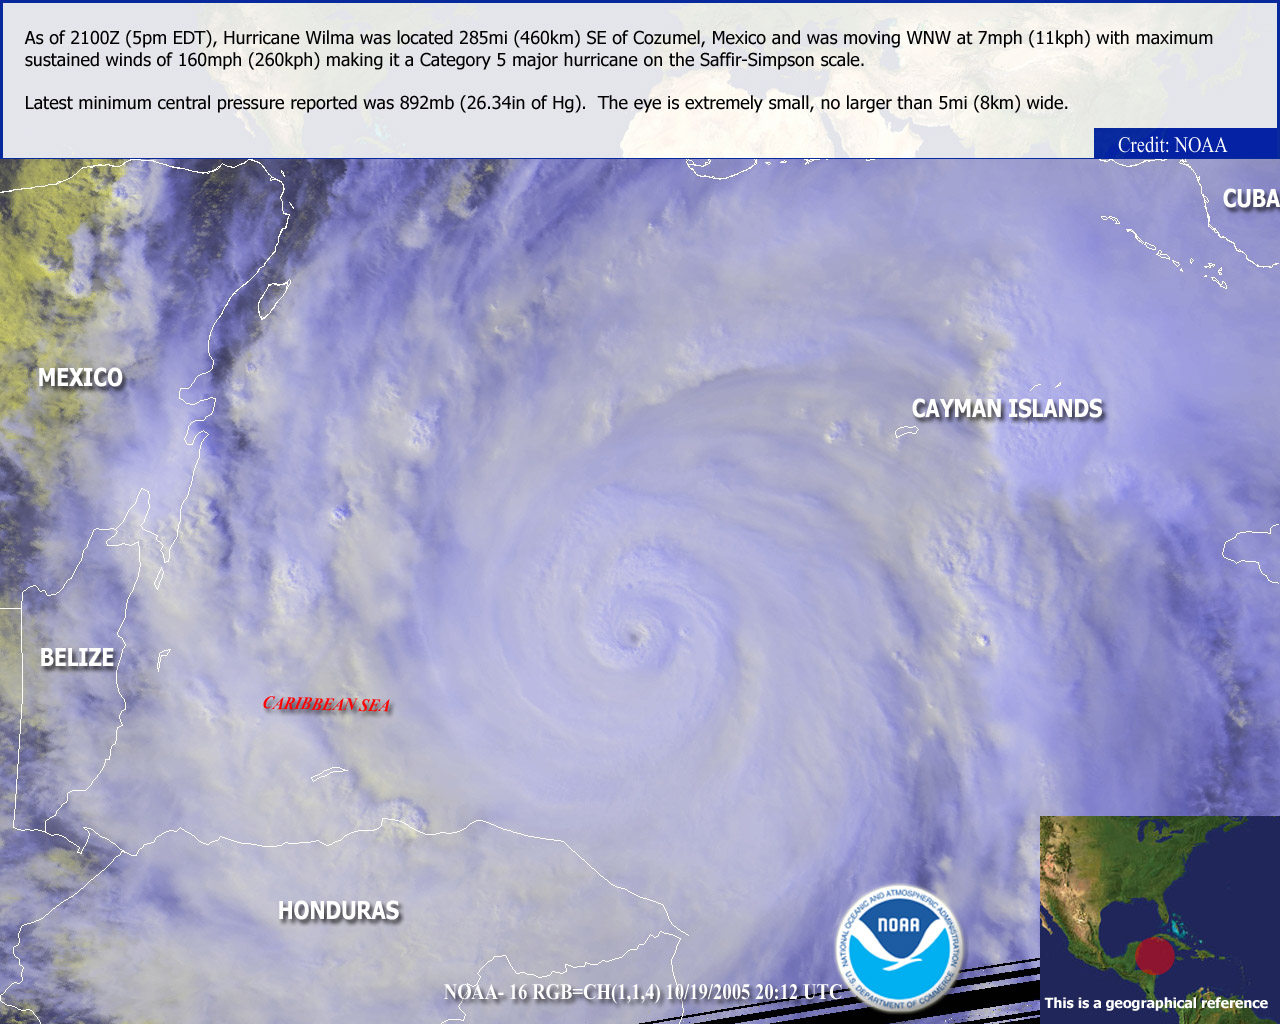
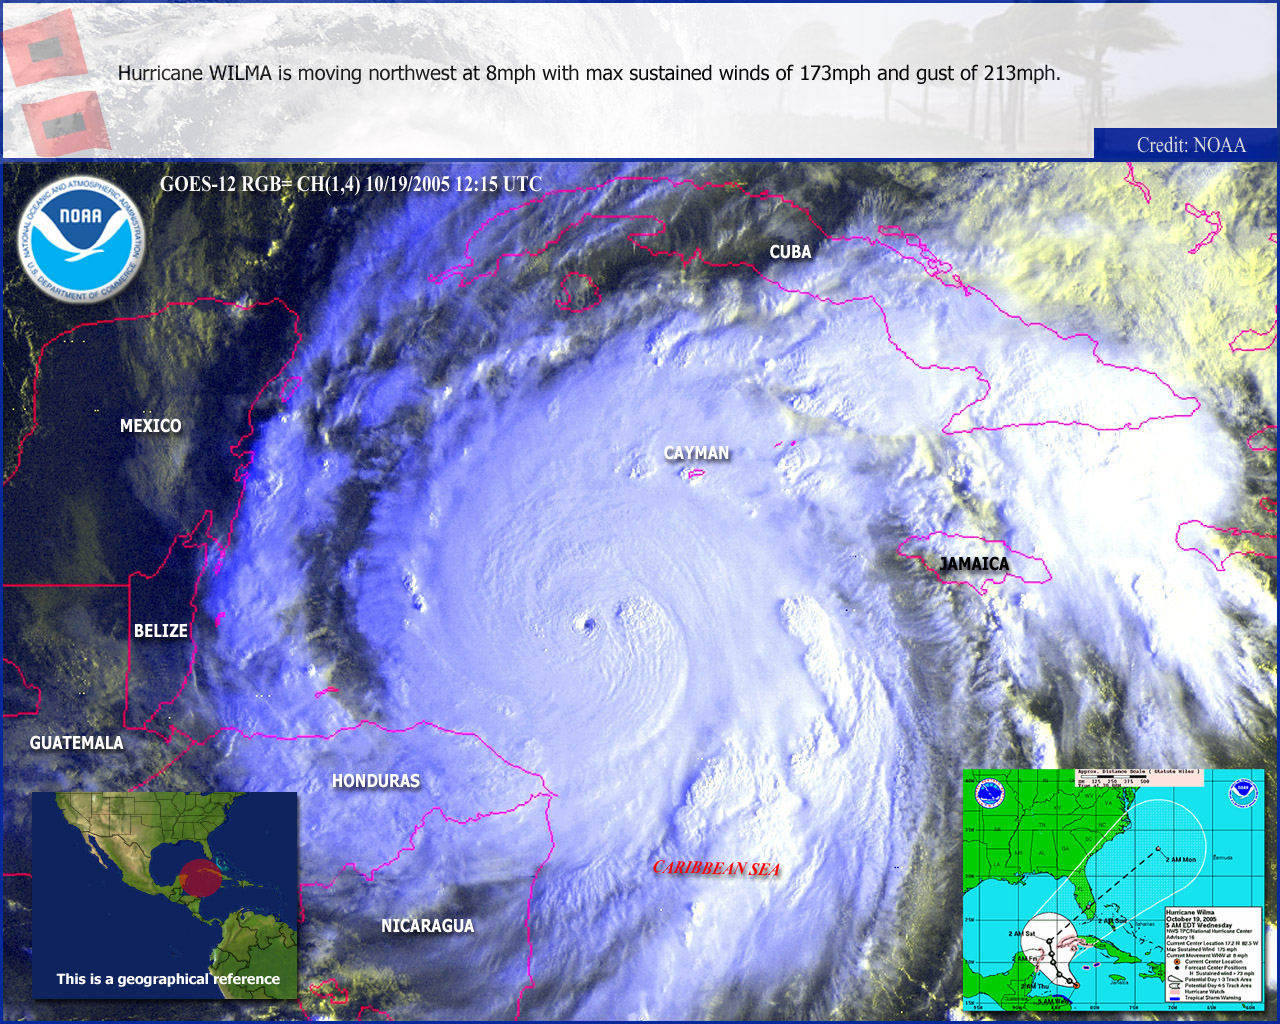
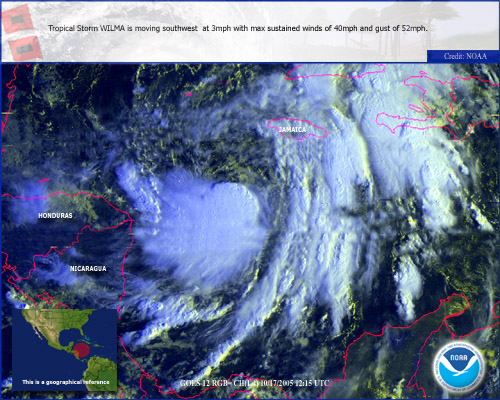
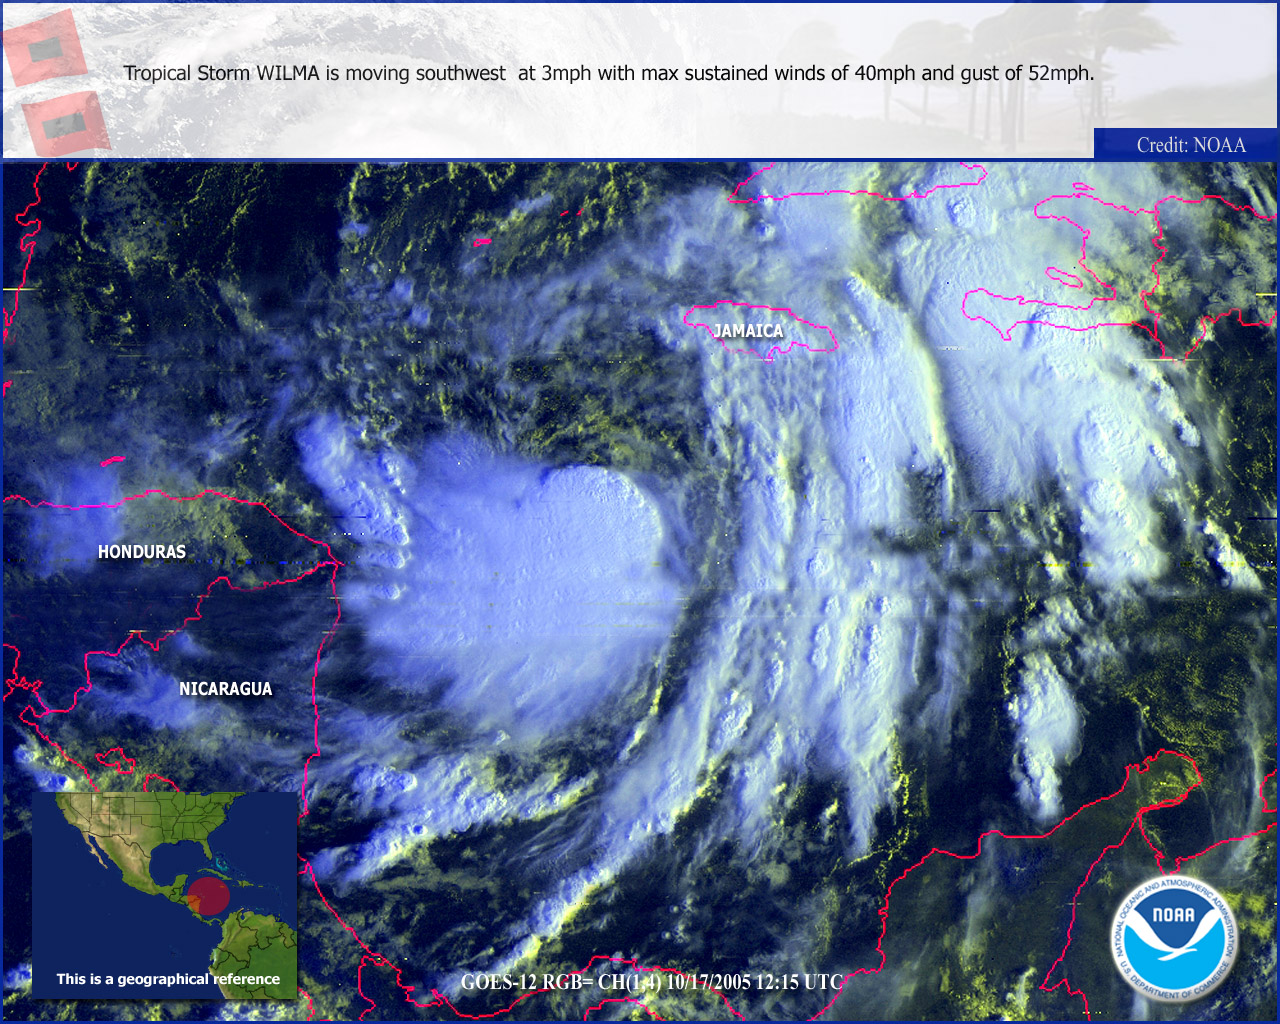
Hurricane Wilma, 12:45Z, October 19, 2005 – About 340 miles southeast of Cozumel, Mexico with maximum sustained winds are near 175 MPH. This makes Wilma a potentially catastrophic category five hurricane on the Saffir-Simpson scale. Dropsonde and flight-level data from an Air Force plane estimated the minimum central pressure to be 882 MB or 26.05 inches just edging out Hurricane Gilbert (estimated 882-885 Mb) for the lowest pressure on record for a hurricane in the Atlantic Basin.
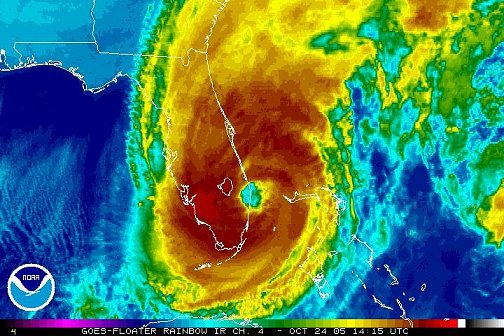
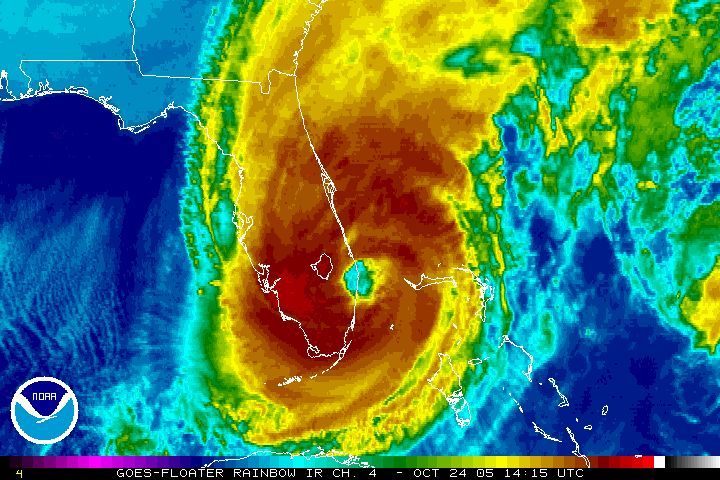
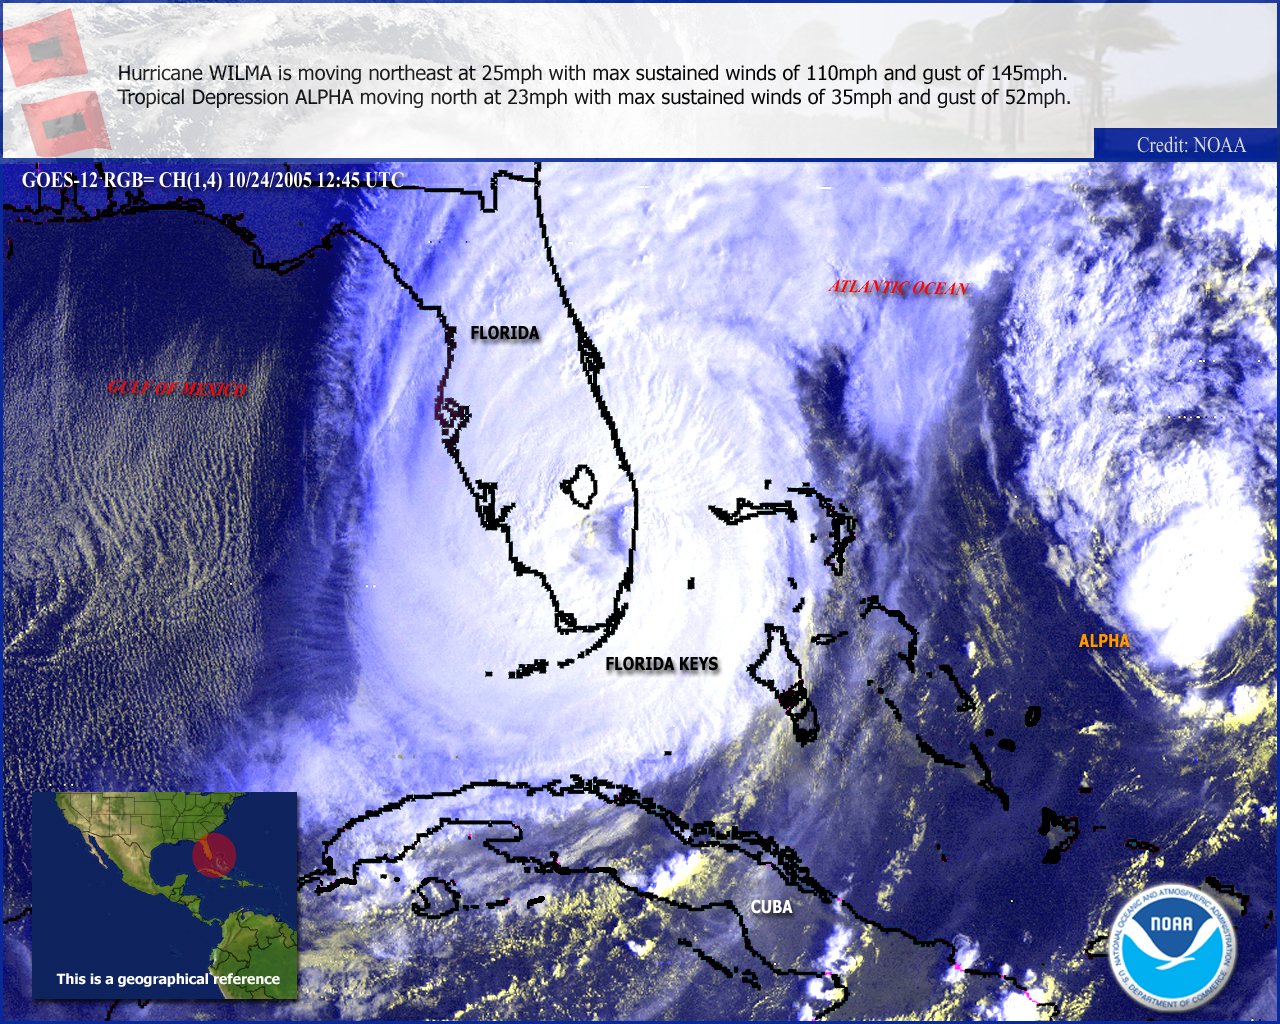
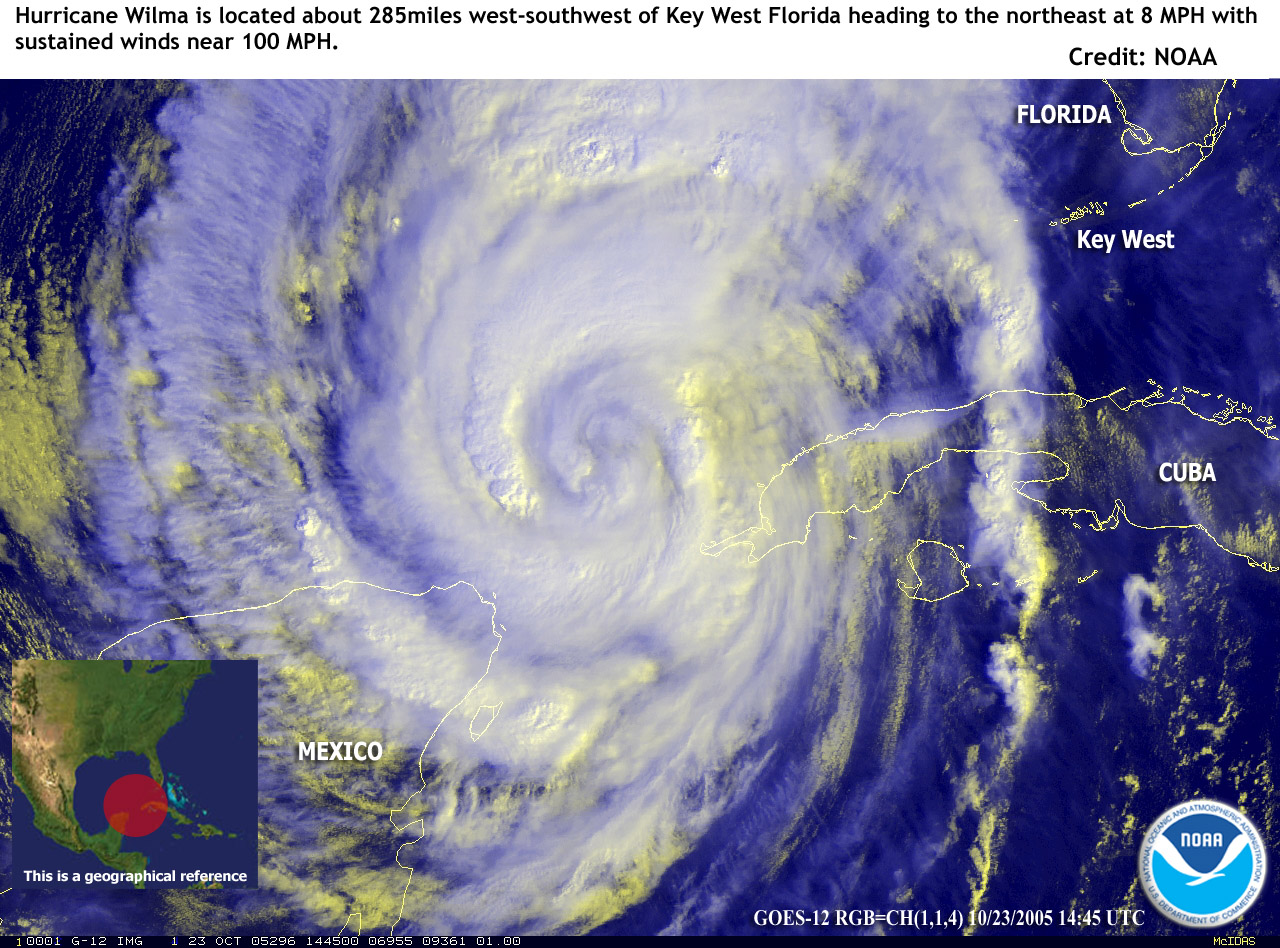
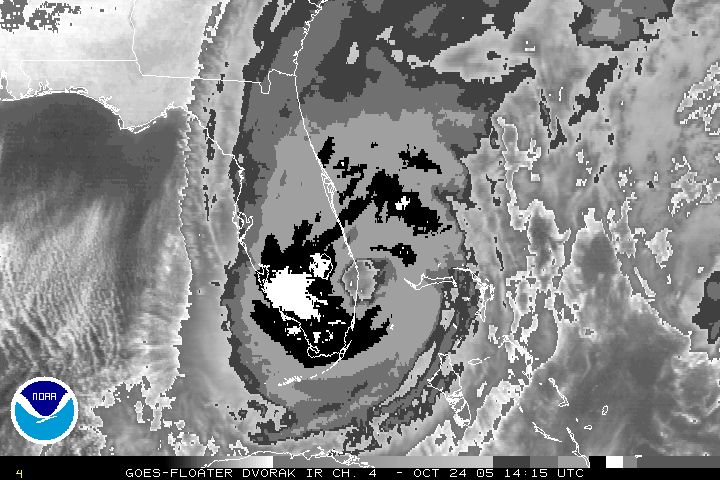
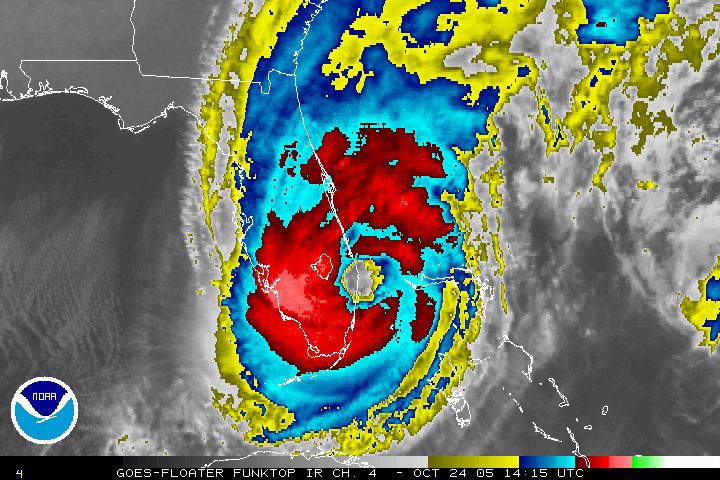
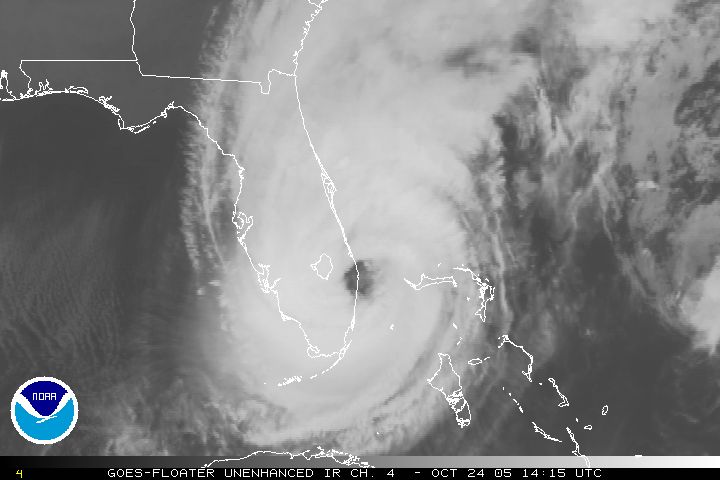
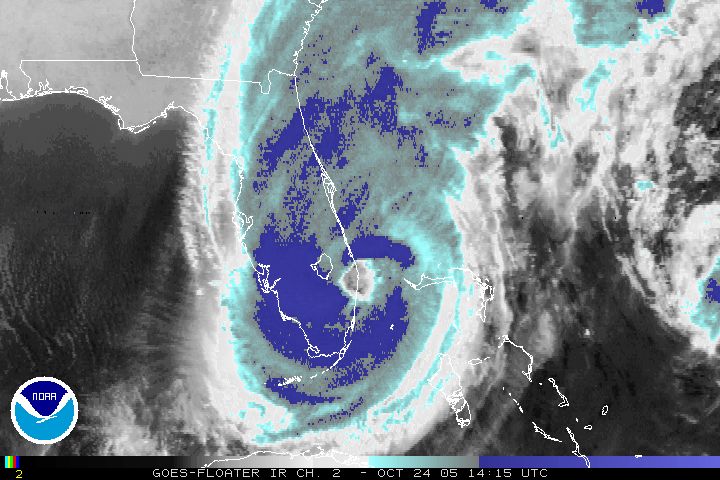
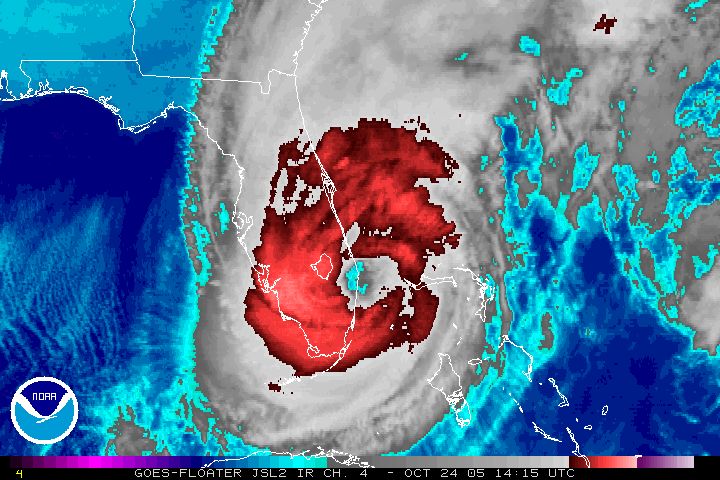
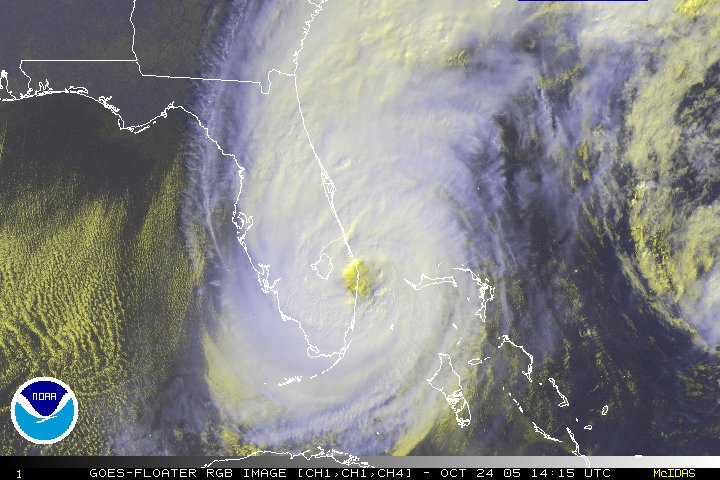
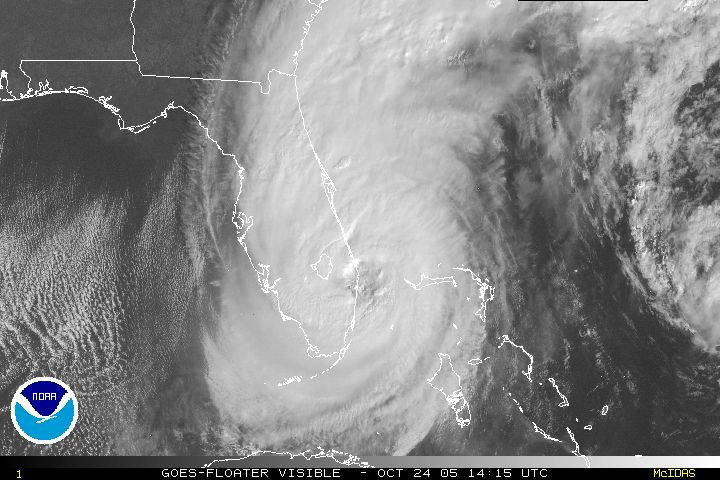
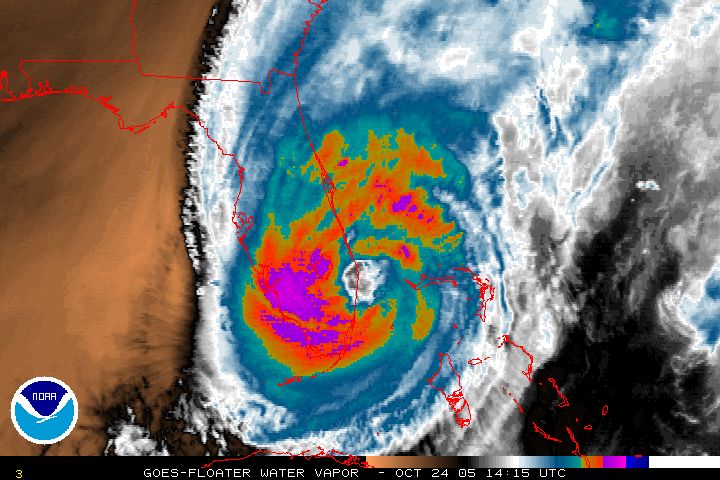
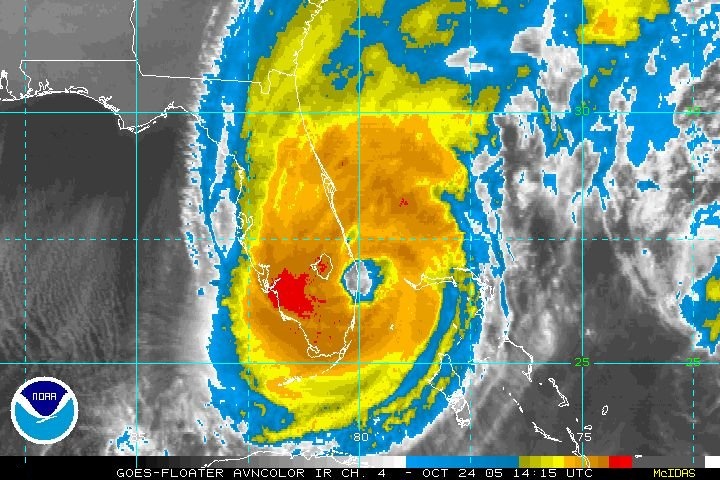
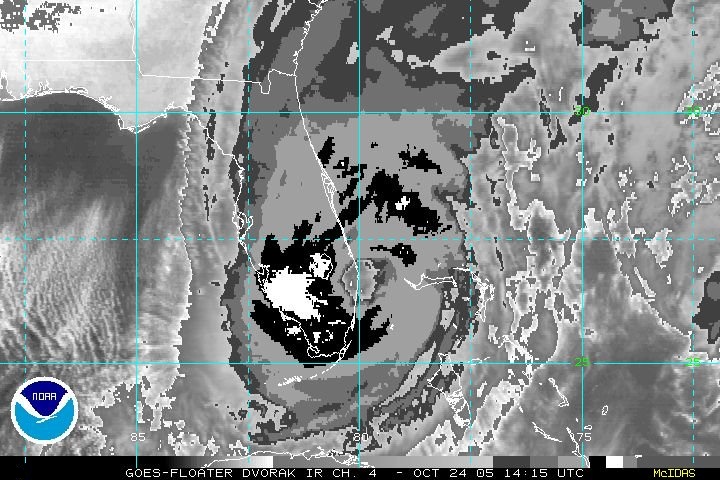
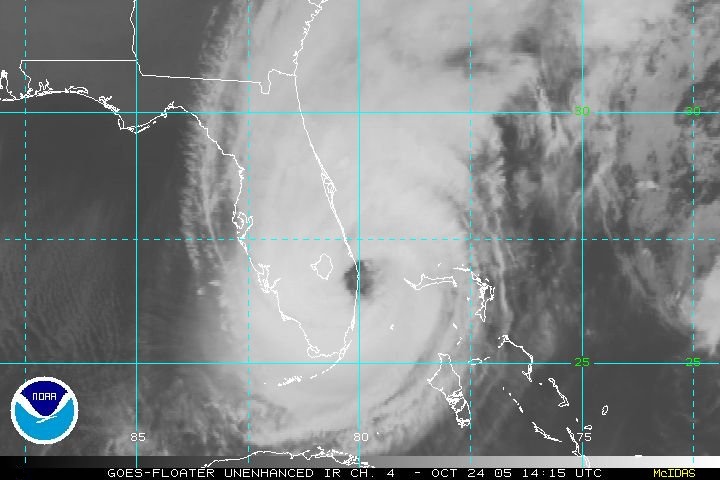
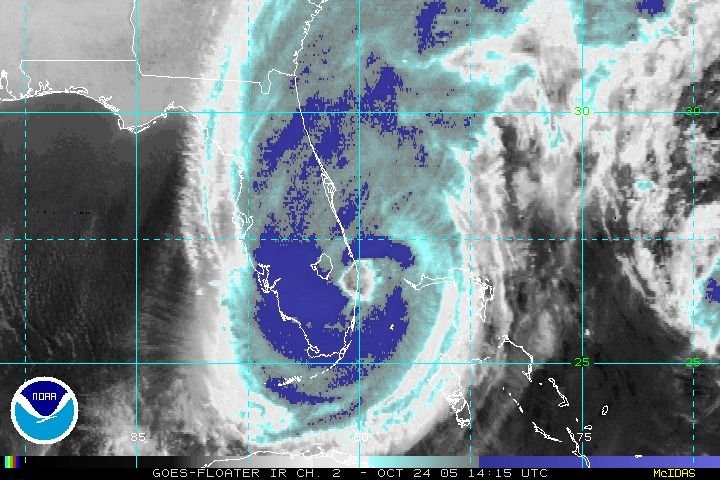
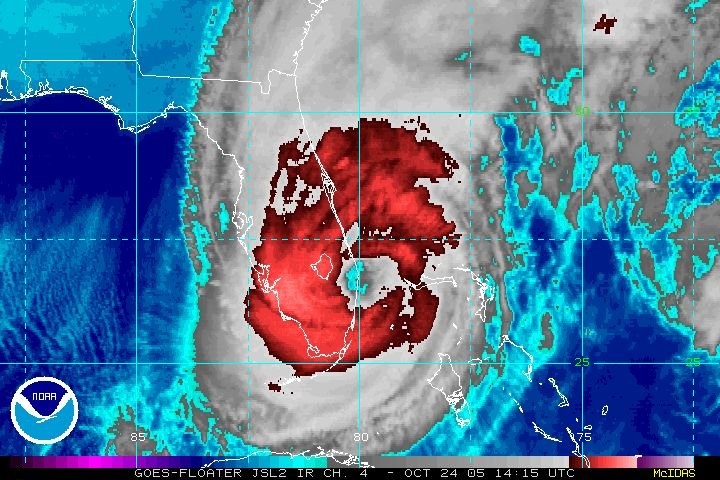
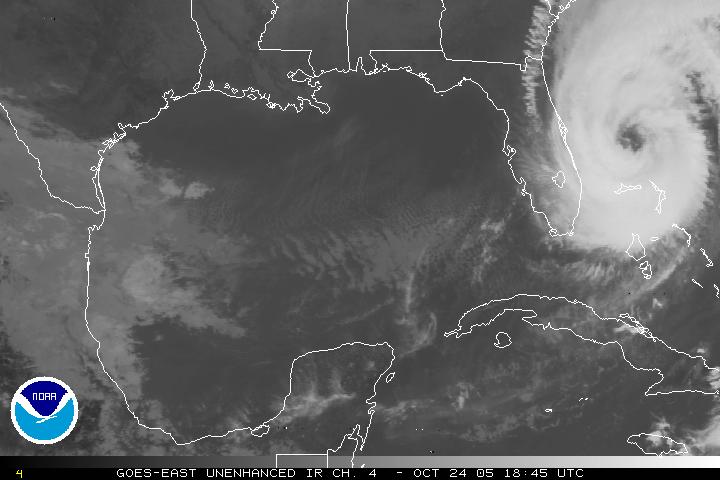
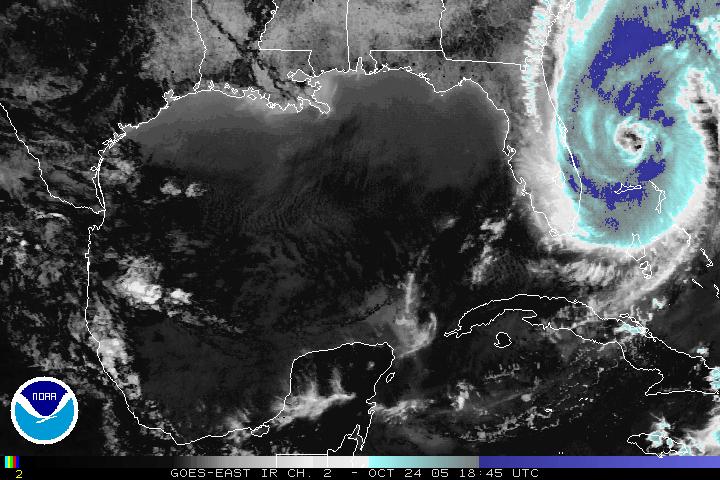
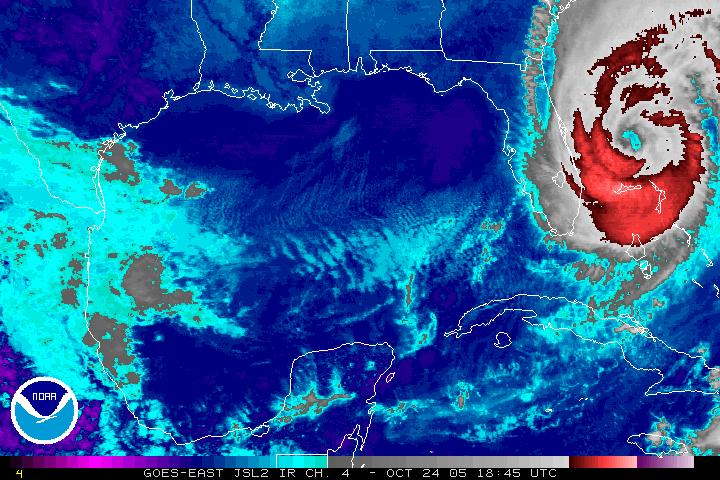
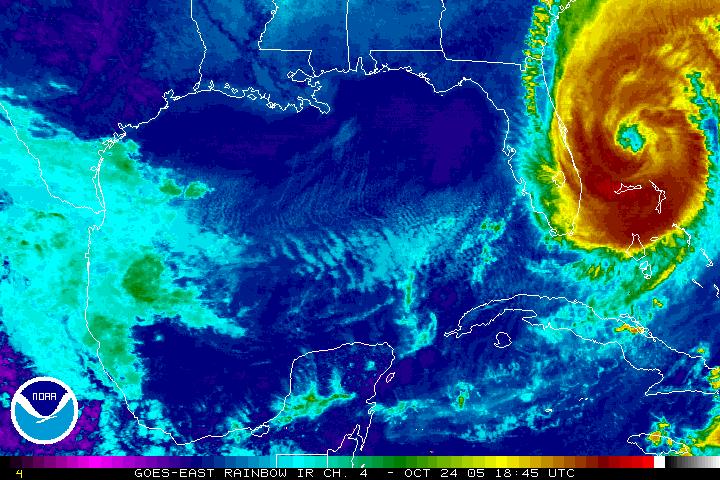
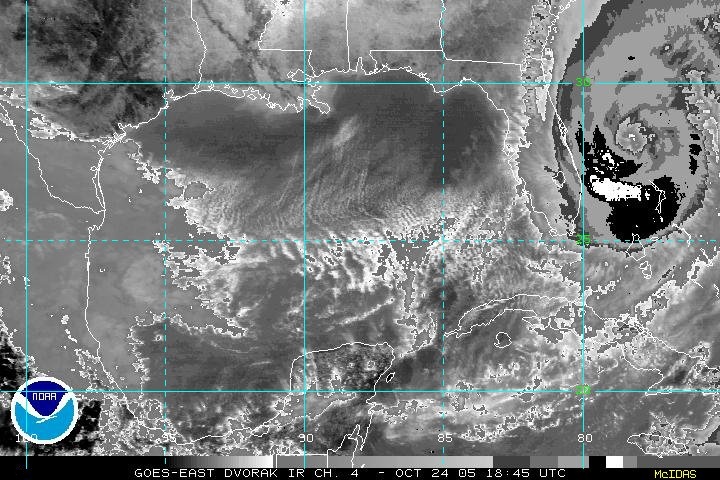
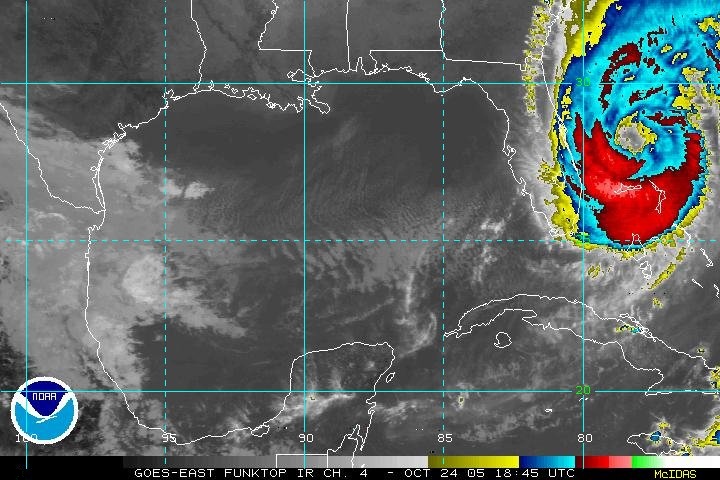
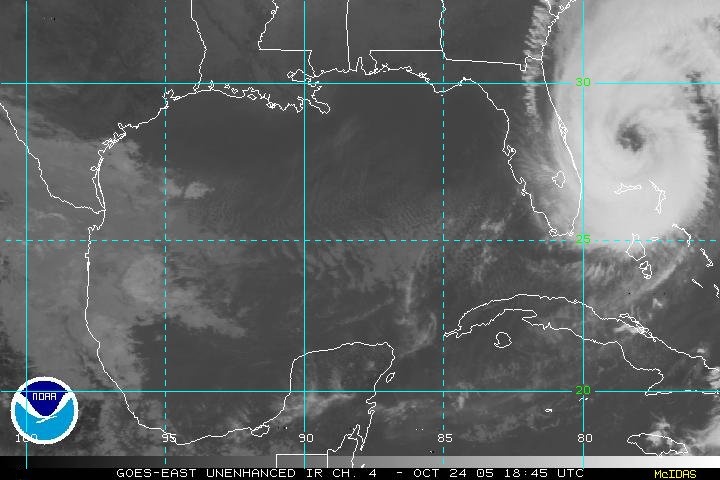
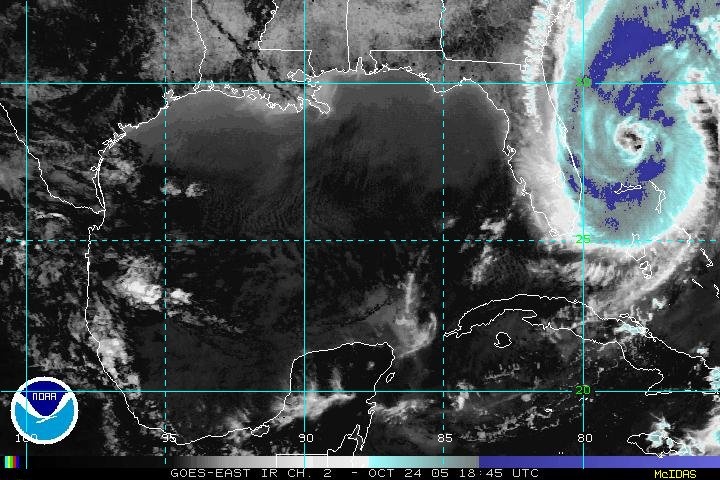
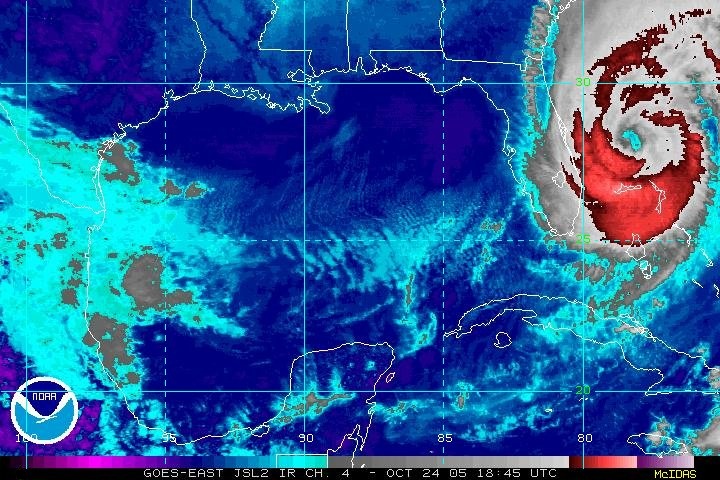
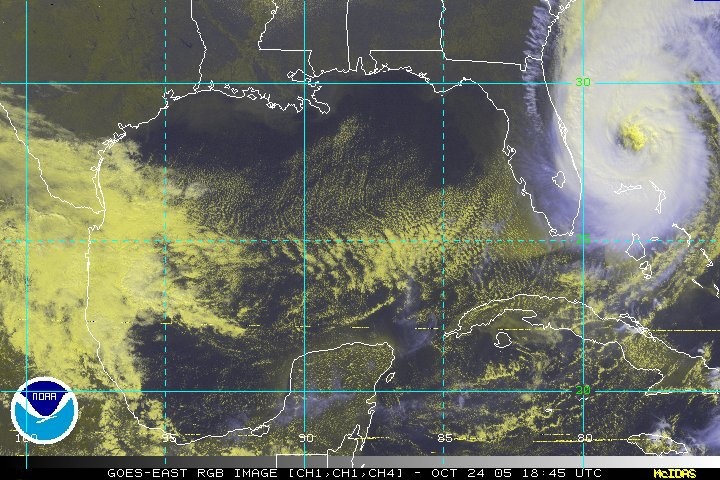
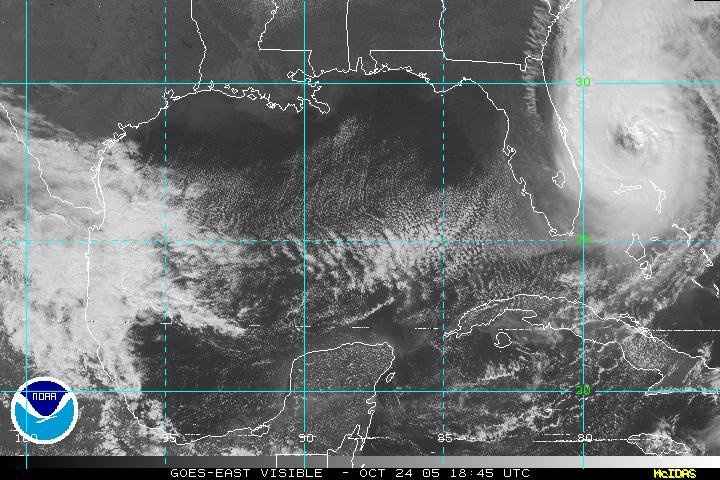
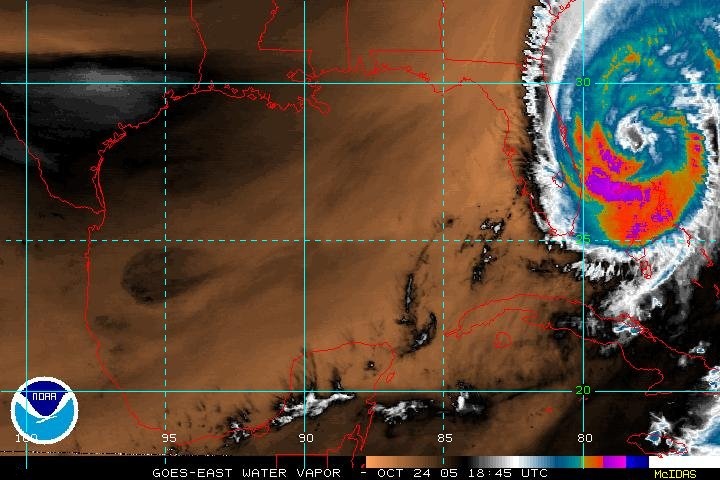
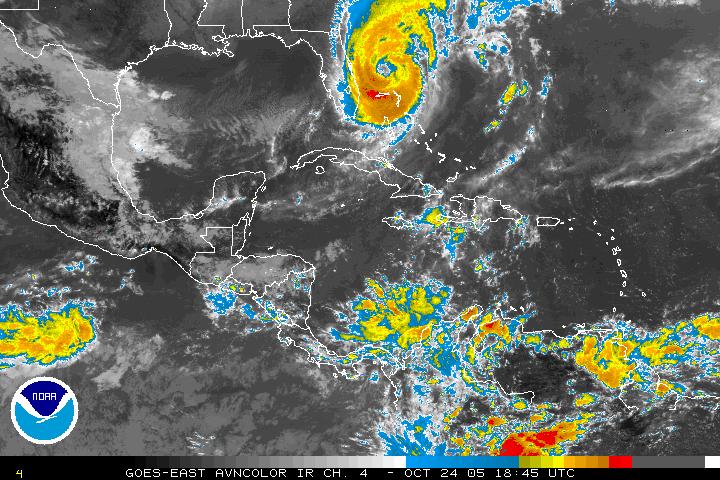
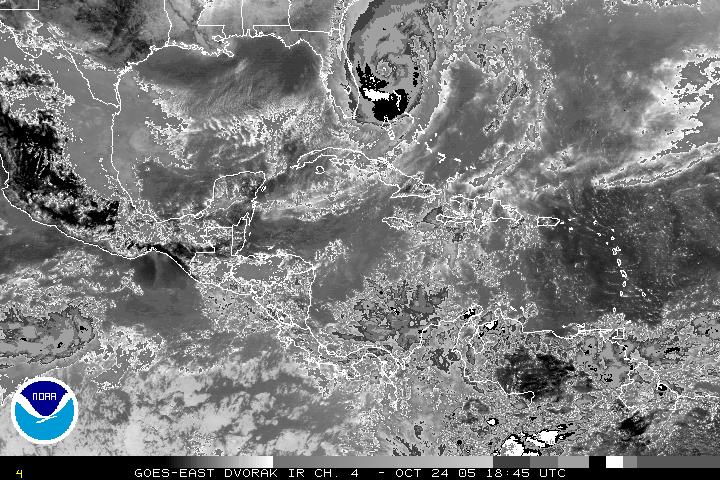
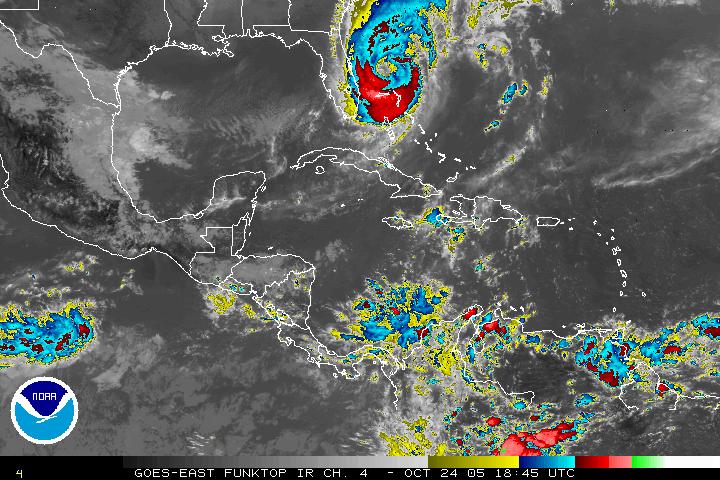
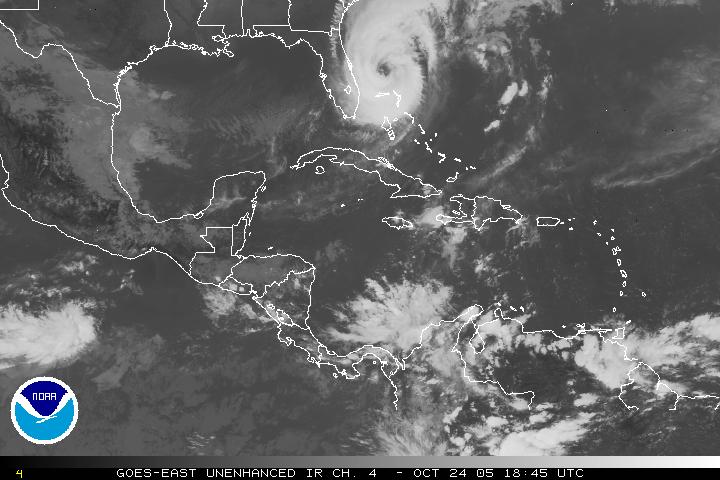
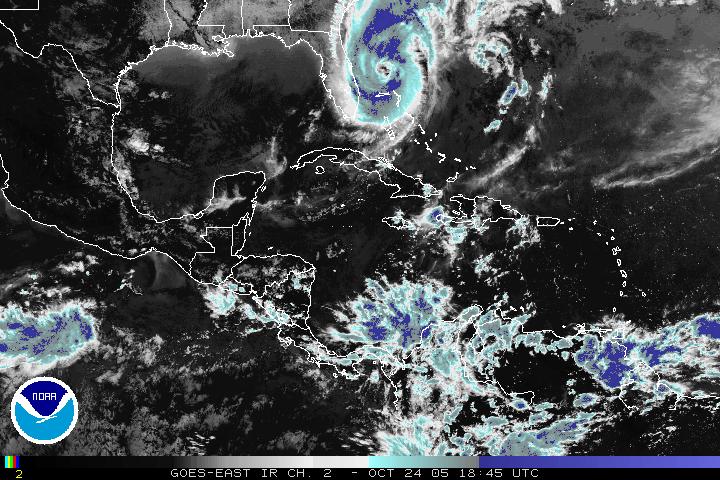
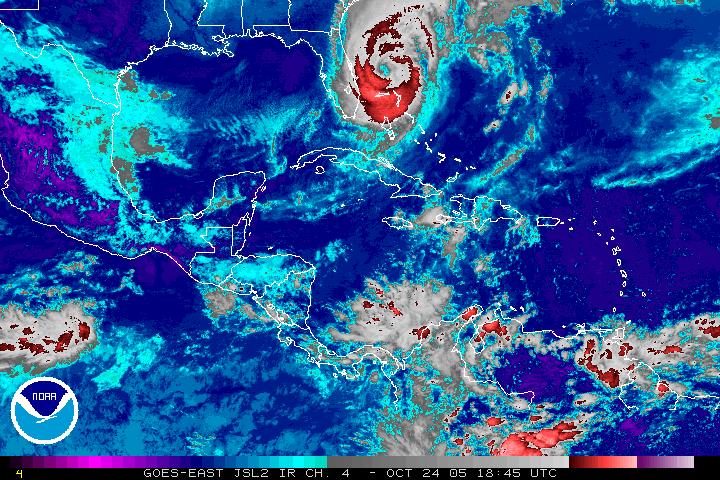
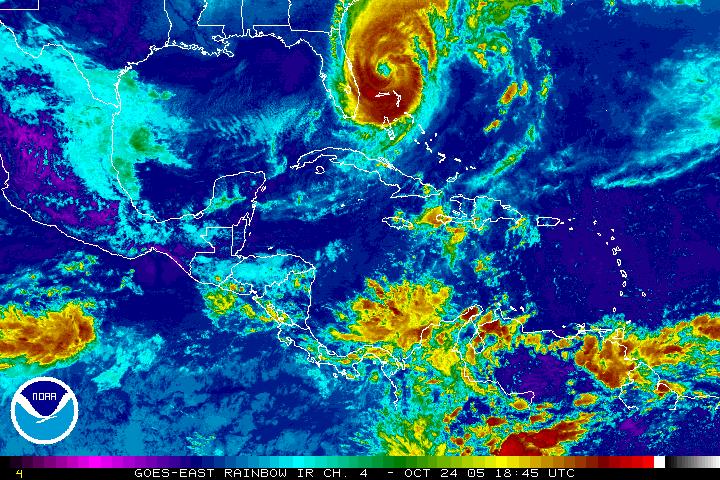
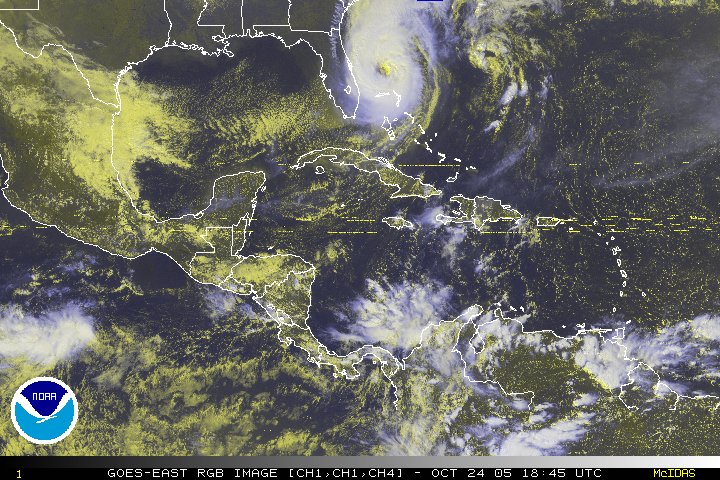
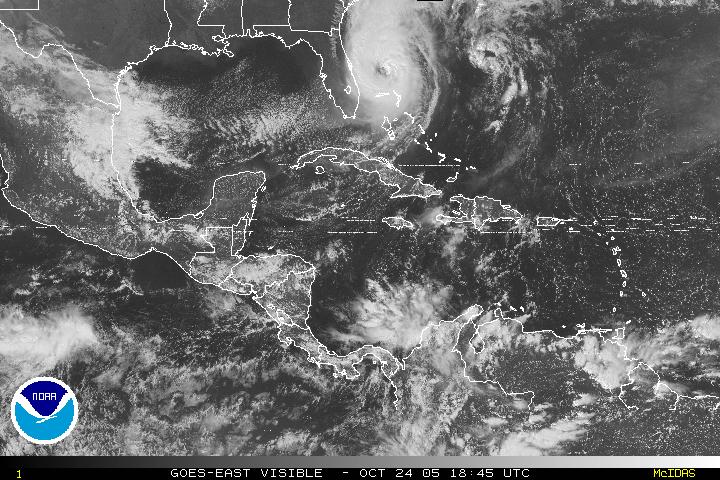
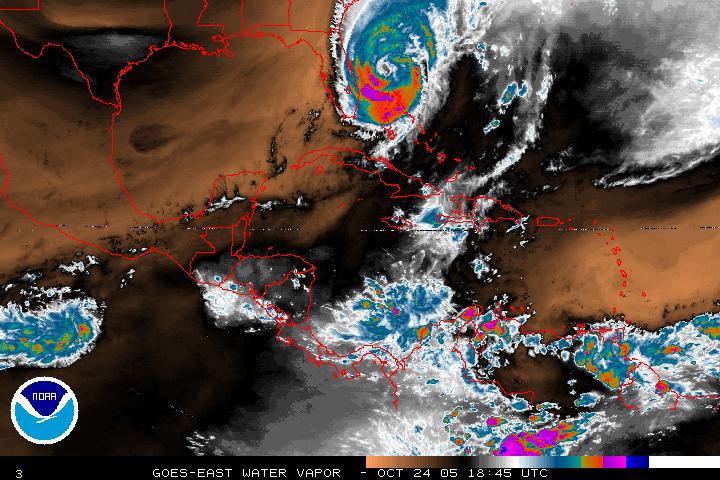
Hurricane Wilma, 14:15Z, October 24, 2005 – Just northeast of West Palm Beach Florida. Maximum sustained winds were near 105 MPH with higher gusts making Wilma a category two hurricane on the Saffir-Simpson scale. The eye was estimated at 55 Nautical Miles wide.
Hurricane Wilma Operational Significant Event Images
National Hurricane Center
Tropical Cyclone Report
and Advisory Archive.
|
Floater Imagery
October 24/0715Z to 24/1415Z:
Image:
AVN |
BD |
FT |
IR |
IR2 |
JSL |
RB |
RGB |
VIS |
WV
Image (w/ Latitude & Longitude):
AVN |
BD |
FT |
IR |
IR2 |
JSL |
RB |
RGB |
VIS |
WV
Loop:
AVN |
BD |
FT |
IR |
IR2 |
JSL |
RB |
RGB |
VIS |
WV
Gulf Of Mexico Imagery
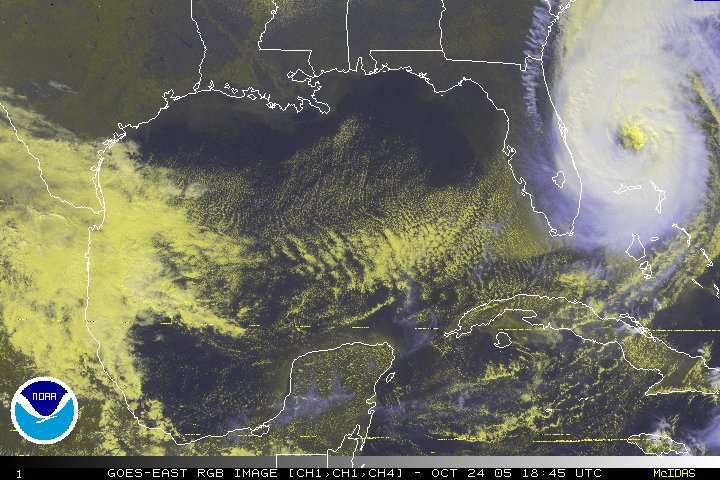
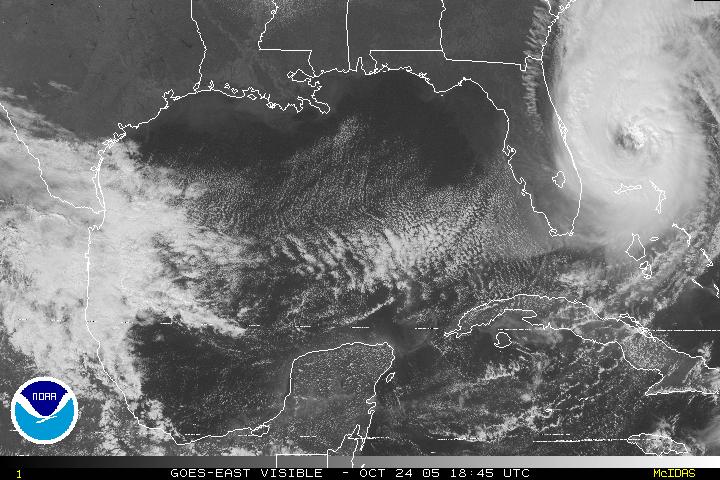
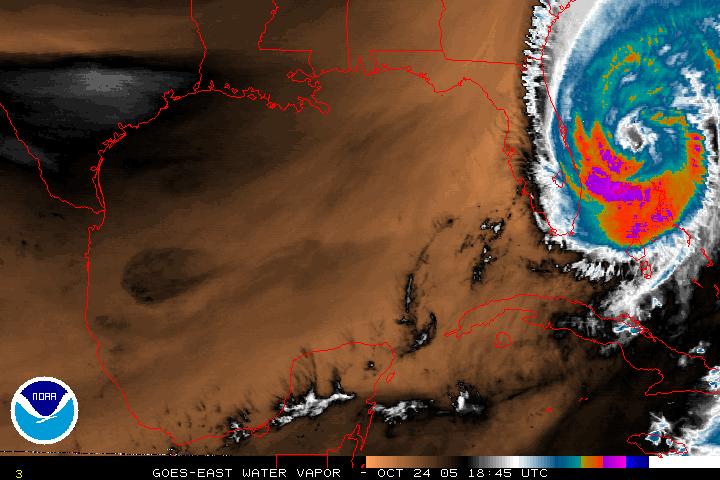
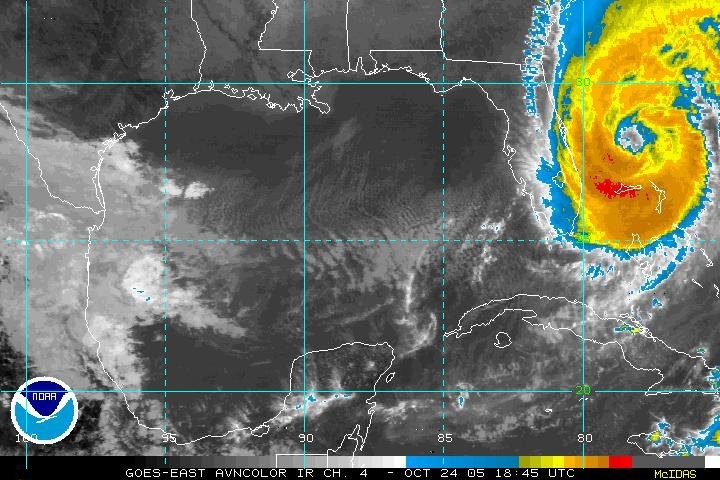
October 24/0715Z to 24/1845Z:
Image:
AVN |
BD |
FT |
IR |
IR2 |
JSL |
RB |
RGB |
VIS |
WV
Image (w/ Latitude & Longitude):
AVN |
BD |
FT |
IR |
IR2 |
JSL |
RB |
RGB |
VIS |
WV
Loop:
AVN |
BD |
FT |
IR |
IR2 |
JSL |
RB |
RGB |
VIS |
WV
Western Atlantic Imagery
October 24/0715Z to 24/1845Z:
Image:
AVN |
BD |
FT |
IR |
IR2 |
JSL |
RB |
RGB |
VIS |
WV
Loop:
AVN |
BD |
FT |
IR |
IR2 |
JSL |
RB |
RGB |
VIS |
WV
Downloadable AVI Files
Wilma Floaters
23/2215Z to 25/0645Z ( ~6 Mb ):
AVN |
BD |
RB
17/0715Z to 19/1345Z ( ~9.5 Mb ):
AVN |
BD |
RB |
RGB
Tropical Rainfall Potential (TRaP)
October 24:
09:15:16.GIF |
04:22:03.GIF
October 23:
17:59:00.GIF |
09:14:31.GIF
October 22:
19:15:46.GIF |
10:43:37.GIF
October 21:
16:24:27.GIF |
09:46:16.GIF |
06:10:39.GIF
01:32:32.GIF
October 20:
20:14:38.GIF
October 19:
15:06:01.GIF |
00:30:36.GIF
Rain Rate
October 24:
09:15:16.GIF |
04:22:03.GIF
October 23:
17:59:00.GIF |
09:14:31.GIF
October 22:
19:15:46.GIF |
10:43:37.GIF
October 21:
16:24:27.GIF |
09:46:16.GIF |
06:10:39.GIF
01:32:32.GIF
October 20:
20:14:38.GIF
October 19:
15:06:01.GIF |
00:30:36.GIF
|