Fire detection point data describe the center latitude/longitude coordinates of the corresponding satellite pixel in which a potential fire event was detected. The exact location of a fire may differ depending on the spatial resolution of the data set from which the fire detection pixel originates, with spatial offsets typically ranging from 10s-100s m (e.g., VIIRS data) up to +1 km (e.g., GOES data). Fire pixels detected over mountain ranges and/or steep terrain can also show larger locational errors that can be introduced by terrain correction procedures normally applied to satellite geolocation data.
Hazard Mapping System Fire and Smoke Product
Product Information
×
GOES Active Fire Detection Data
NOAA's Geostationary Operational Environmental Satellite (GOES) provides 5min observations over the Conterminous U.S. (CONUS imaging sector) and 10min observations over the entire western hemisphere (full-disk imaging sector) with two satellites positioned at 75.2°W (GOES- 16 – launched on November/2016) and 137.2°W (GOES-17 – launched on March/2018).
More
×
VIIRS Active Fire Detection Data
The NOAA/NASA Visible Infrared Imaging Radiometer Suite (VIIRS) was launched onboard the S-NPP polar satellite on October/2011, followed by NOAA-20 - the first of the Joint Polar Satellite System (JPSS) series - on November/2017. Each instrument provides global wall-to- wall coverage every 12h or less around 1:30am/pm local time.
More
×
MODIS Active Fire Detection Data
NASA's Earth Observing System (EOS) Moderate Resolution Imaging Spectroradiometer (MODIS) can be found onboard the Terra and Aqua satellites launched on December/1999 and May/2002, respectively. Together, they provide sub-daily global observations around 10:30am/pm and 1:30am/pm local time.
More
×
AVHRR Active Fire Detection Data
NOAA's Advanced Very High Resolution Radiometer (AVHRR) has, for nearly four decades, been an integral part of the NOAA suite of polar environmental monitoring satellites.
More
×
Hazard Mapping System
NOAA/NESDIS Satellite Analysis Branch's Hazard Mapping System (HMS) was first implemented in 2002 in response to high demand for active fire and smoke information over North America.
More
×
VIIRS Fire Data Statistics
Cumulative fire data statistics are calculated daily for all 50 U.S. states using science-quality data from a combination of Aqua/MODIS 1km
More
×
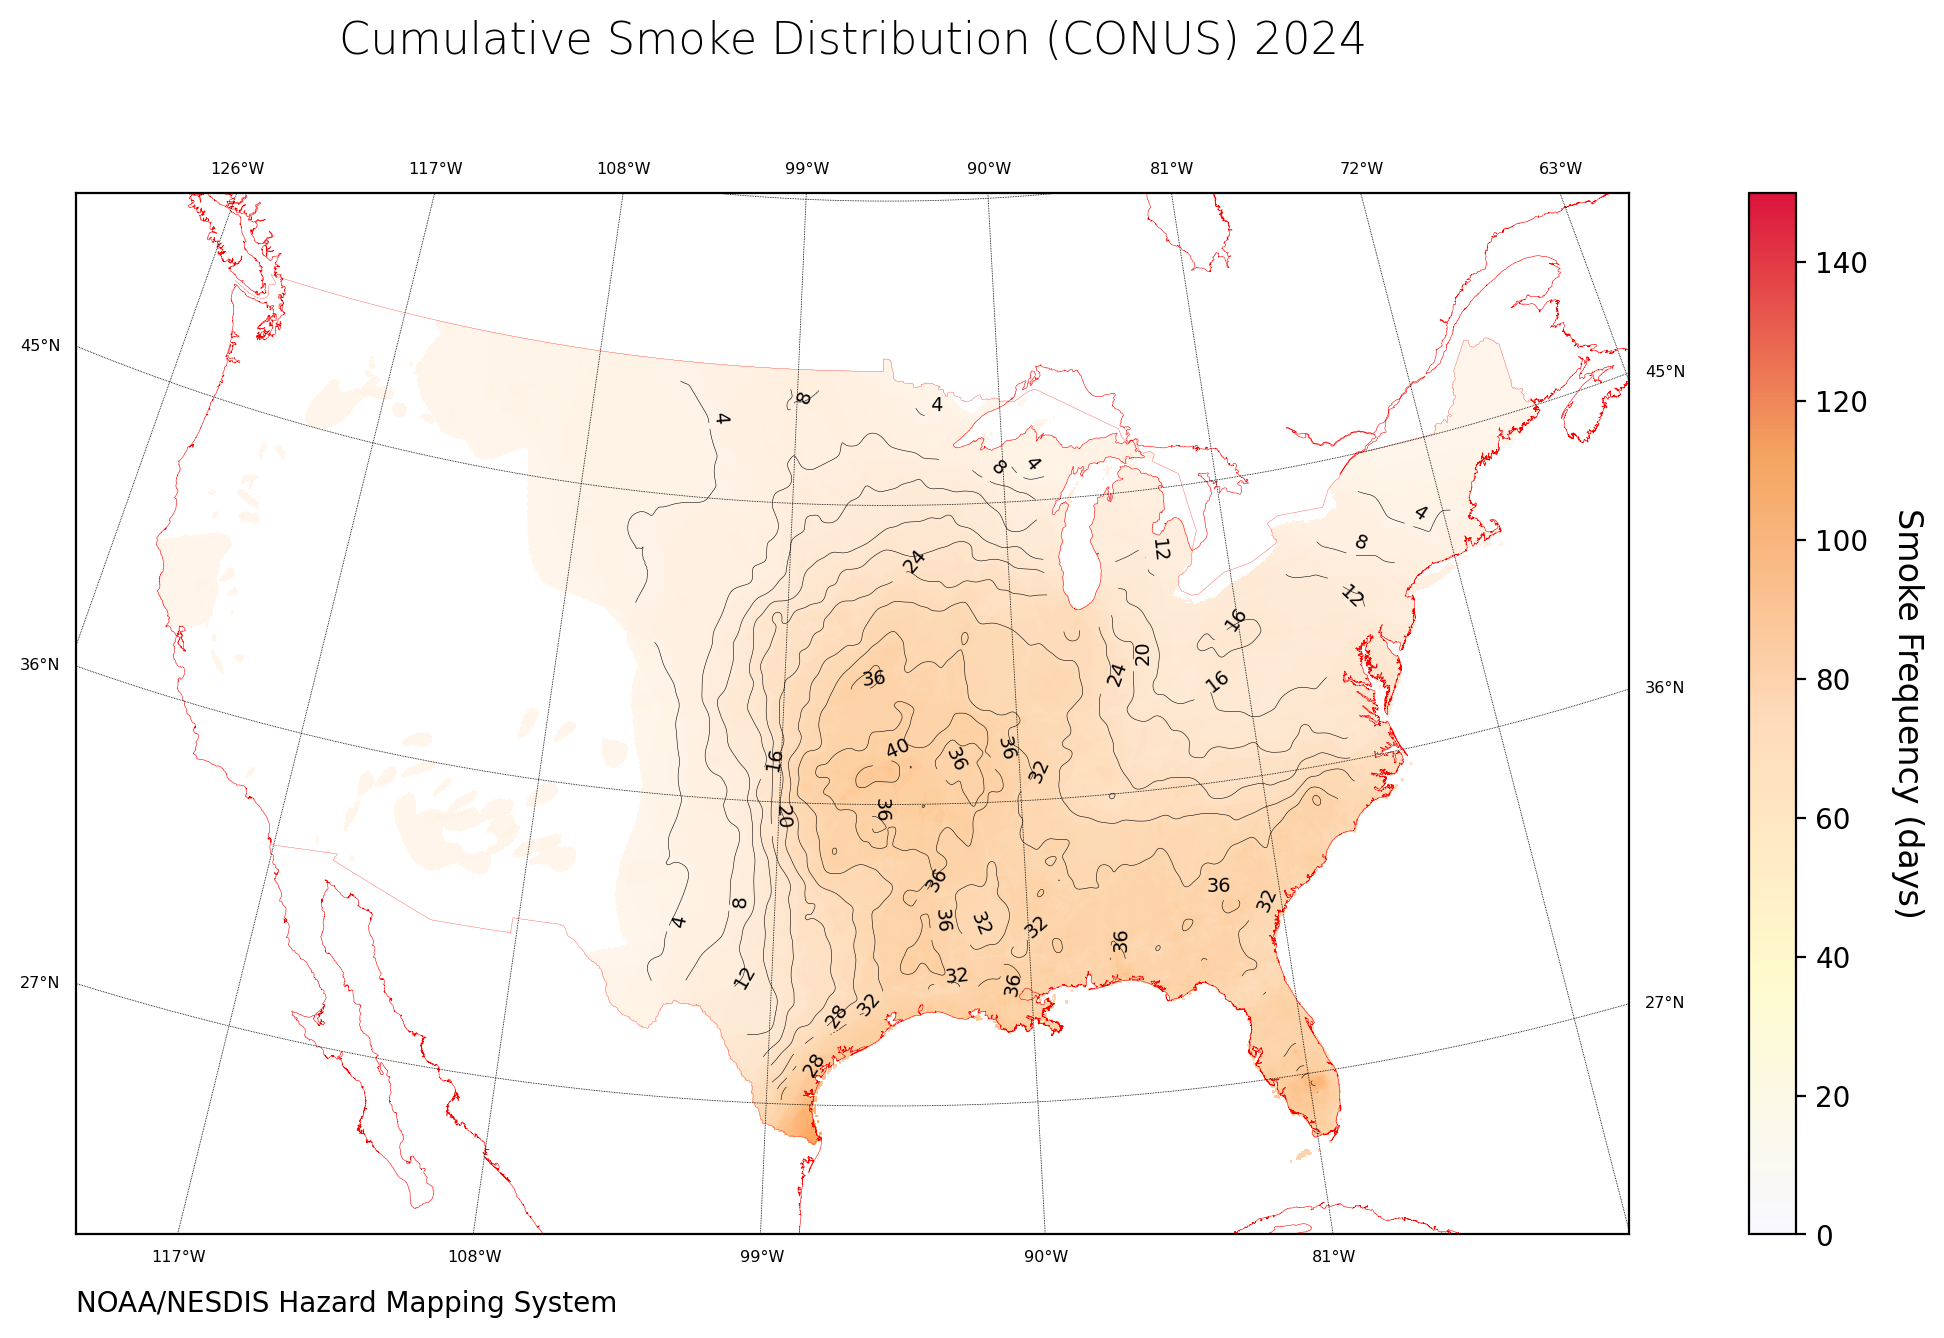
HMS Smoke Data Statistics
Cumulative smoke data annual statistics are derived by aggregating daily Hazard Mapping System (HMS) smoke polygons into a 0.05° grid and counting the number of days when individual cells were covered by either light, moderate or thick smoke during the year.
More
FAQ
HMS fire and smoke data products are marked with the time stamp representing the corresponding satellite image acquisition (observation) time in Universal Time Coordinated (UTC), and date using the Julian day calendar () (0-365 day of year for regular years, 0-366 for leap years). In order to obtain U.S. Eastern, Central, Mountain and Pacific times, users must subtract 5, 6, 7, 8 hours from UTC time, respectively (4, 5, 6, 7 hours respectively, when daylight saving time is in effect).
There isn’t an absolute size above which one can expect a fire detection from satellites. Fire detection is largely a function of spatial resolution, with coarser data sets typically requiring larger and/or more intense fires for a successful detection compared to higher spatial resolution ones that can resolve smaller and/or less intense fires. With that being said, traditional satellite fire detection algorithms currently used with the MODIS, VIIRS and GOES fire products begin to respond to active fires occupying a relatively small fraction (≥ 0.01 %) of the pixel footprint (assuming an average fire temperature of ≥ 800 K). For example, a fire must have an active area ≥ 100m2 to enable detection by a satellite pixel with an effective resolution of 1km. Increasing satellite view angles (or distance between the fire and the satellite sub-point or image center line) will lead to pixel area enlargement, effectively degrading the spatial resolution of the data and requiring larger fire areas for detection. Other factors can also affect detection performance and contribute to omission errors, including obscuration by terrain and/or forest canopies, clouds, and proximity to water bodies where the land/water separation by the algorithm may be imperfect. Meanwhile, smoke is usually transparent in the mid-infrared spectrum used in fire detection although thick and/or vertically developed smoke plumes (e.g., pirocumulus) can be confused with clouds during daytime observations causing potential omission errors.
Fire pixels do not translate into absolute fire area and their use should serve as a coarse indicator only. Due to the same reasoning described in FAQ-2 above, a fire detection can be produced for fires occupying small fractional areas of the pixel. In fact, only in relatively rare occasions will a fire occupy the entire footprint of a pixel (those cases are typically reserved to large wildfires). As a result, use of the pixel area to estimate fire size could produce gross overestimation of the actual perimeter.
Commission errors may be observed in the satellite fire products due to ambiguity between actively burning fires and other image features predominantly found during the sunlit part of the day. Those occurrences are typically associated with fresh burn scars and sandy soils that can cause an elevated signal in the mid-wave infrared (MIR) channel data. Other false alarm instances may be associated with Sun glint occurrence over optically bright and/or specular surfaces (e.g., large solar panel clusters or metallic rooftops, clouds, and water bodies). Users must also note that thermal anomalies linked to industrial activities (e.g., steel mills, gas flaring) and structural fires in urban environment may be present in these data. Such occurrences are normally removed from the quality-controlled Hazard Mapping System product.
There have been a number of cases involving large and intense wildfires over which tall plumes carrying large volumes of hot material into the air were formed when the VIIRS 375 m product detected the surface fire along with part of the plume. Those occurrences typically share the following set of conditions:
- Nighttime detection: this is the period during which the VIIRS product is particularly responsive to heat sources thereby favoring plume detection;
- Very large wildfires undergoing explosive growth accompanied by rapid/vertically elongated plume development. Enough hot material must entrain the plume creating a distinguishable thermal signal (i.e., one that significantly exceeds the fire-free surface background)
- High view angle: this is what will ultimately produce the detections extending beyond the actual fire perimeter. The parallax effect causes the tall/super-heated plume detection pixel(s) to be displaced laterally when projected onto the ground. Displaced pixels will be located on the fire perimeter’s side further away from the image center and closer to the swath’s edge.
HMS image analysts will try and identify these cases and take the appropriate action to correct the output fire data. Users working independently with VIIRS fire detection product are encouraged to look for alternative observations from previous/next satellite overpasses acquired closer to nadir whenever confronted with suspicious fire pixels matching the description above.
FRP describes a fire pixel attribute available with most operational satellite fire detection products these days that is directly related to the rate of biomass consumption during the active (flaming/smoldering) phase of a fire. It is a form of sub-pixel fire characterization that can be used as input for direct/indirect fire emissions calculations as well as in support of fire management applications. The highest FRP values in a fire perimeter will potentially indicate the most active/intense segments of the fire, where relatively high rates of energy release are found. With that being said, fuel, weather and overall observation conditions will influence absolute FRP values therefore caution should be exercised when using that parameter. For example, a pixel’s FRP value of 50 MW in a small grassland burn could be associated with the most intense segment of that fire whereas it may describe the lowest intensity part of a large wildfire.
Satellite fire detection products are defined as Level 2 data, therefore relying on the upstream Level 1 radiance files for processing. Level 1 data latency varies greatly between geostationary and polar orbiting system. GOES full disk Level 1 data become available within ~20-30 min from the actual observation, whereas the smaller imaging sector covering the Conterminous United States (CONUS) is usually available within 10-15 min from observation. GOES fire data processing adds another 5-15 min to the processing time. Comparatively, polar orbiting (MODIS, VIIRS) Level 1 data become available within 1:30-2:30 h from the time of observation with fire data processing adding another 5-10min. In the case of the HMS outputs, latency can further increase by another 1-3 h on average as image analysts perform detailed data quality assessment analysis.
It really depends on the type of analysis involved in the study. HMS is a forward processing near real-time fire and smoke monitoring system using the best available satellite data at any given time. As a result, any data gap due to planned or unplanned system downtimes or other data flow interruptions will not be back-filled. Moreover, the addition and removal or satellite data sets over time can introduce large variation in system performance. For example, the implementation of S-NPP & NOAA-20 VIIRS 375 m and GOES/ABI 2 km resulted in a significant spike in the number of daily fire pixels output by the system. Similarly, smoke mapping can be greatly affected by the observation conditions (most often as a result of cloud interference) which can lead to incomplete representation of smoke coverage.
Email your questions to the HMS fire team at: ssdfireteam@noaa.gov
Frequency Maps - Pixel Count
Click on the image to enlarge and/or download
Cumulative Smoke Data Statistics
Click on the image to enlarge and/or download
Please note: Data for Current Year is Cumulative from the 1st of the year to the current day
Fire Data Search and Retrieval
Date Range:
Current Analysis
Analysis for day 04/27/2024 last updated Apr 27, 2024 11:26:30 GMT
Disclaimer: The location of the fires displayed may be slightly offset from the actual fire location due to satellite resolution.
For questions or comments please contact SSDFireTeam@noaa.gov
Important Information
The information on fire position should be used as general guidance and for strategic planning. Tactical decisions, such as the activation of a response to fight these fires and evacuation efforts, should not be made without other information to corroborate the fire's existence and location. Users should note:- The initial HMS product for the current day is created and updated by a satellite analyst roughly between 8am and 10am Eastern Time. After 10am, the analysis is fine-tuned as time permits as additional satellite data becomes available. Areas of smoke are analyzed and added to the analysis during daylight hours as visible satellite imagery becomes available. The product is finalized and "completed" for the archive the following morning - generally by around 8am.
-
The fire sizes depicted in the product are primarily determined by the field of view of the satellite instrument, or the resolution of the analysis tool. They should not be used to estimate specific fire perimeters.
Satellite fire detection data are displayed using a color scheme based on the pixel's fire radiative power (FRP), given in MegaWatts [MW]). Higher FRP values may describe the most active portion of a fire pixel cluster at the moment of observation, whereas absolute values can be greatly influenced by imaging conditions. A fill value of -999 is used when no FRP retrieval is available.
- The ability to detect fires and smoke can be compromised by many factors, including cloud cover, tree canopy, terrain, the size of the fire or smoke plume, the time of the day, etc. The satellite sensors used to detect fires are sensitive to heat sources and reflected sunlight. Analysts do their best to distinguish between fires and other heat sources or highly reflective surfaces, such as factories, mines, gas flares, solar panels, clouds, etc. but some false detects do get included in the analysis.
Useful Links
NESDIS Products
- AerosolWatch
- VIIRS imagery and fire product global visualization
- GOES image viewer
- GOES Aerosol Smoke Products (GASP) West
- IDEA (Air Quality)
- Automated Smoke Detection and Tracking Algorithm (ASDTA) GOES-West
Fire and Smoke Related Weblinks: