Global Hydro-Estimator - Algorithm DescriptionThe Hydro-Estimator (H-E) is a single-channel (11-μm) rain rate algorithm whose origins go all the way back to the semi-automated Interactive Flash Flood Analyzer (IFFA; Scofield 1987) which was originally developed in the late 1970s. Many of the IFFA's features were automated into the Auto-Estimator (A-E; Vicente et al. 1998) in the late 1990s, including rainfall rate as a function of IR window brightness temperature(calibrated against radar) and corrections for atmospheric moisture (the product of precipitable water (PW) in inches and decimal relative humidity (RH), orography (enhancements in upslope regions and reduction in downslope regions), and convective equilibrium level (enhances rain rates in regions where the convective equilibrium level height is low but strong updrafts can still occur). However, the A-E frequently assigned high rain rates to cold (but nonraining) cirrus clouds, leading to the H-E which replaced the A-E in 2002. The H-E assigns rainfall only to pixels that are colder than the average of the surrounding cloudy pixels in order to eliminate cirrus clouds, and also uses separate PW and RH corrections to reduce cold-season overcorrection. More details on the H-E are provided below. a. Precipitation Rate EquationsThe primary feature of the A-E is a fixed relationship between rainfall rate and T10.7 that was derived from 6800 pairs of collocated IR brightness temperatures and radar rainfall rates from convective cores of mesoscale convective systems (MCSs) for 16 events from March-June 1995 (Vicente et al. 1998). Regression was used to derive the following relationship:
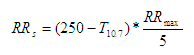
where RR is the rain rate in mm/h and T10.7 is in Kelvin. The original AE modified the brightness temperature according to the convective equilibrium level temperature prior to computing rainfall rates (details in Section c) and also adjusted the computed rainfall rate according to the total precipitable water and lower tropospheric relative humidity from the National Centers for Environmental Prediction (NCEP) Global Forecast System (GFS) model (Section b).
However, even when these factors are accounted for, rainfall rate and cloud-top brightness temperature are not uniquely related to one another. For instance, convective and stratiform precipitation are produced by significantly different mechanisms of upward movement, resulting in considerable differences in vertical and horizontal cloud structure for precipitation of a given intensity. In order to partially account for these differences, the HE differentiates between "convective core" and "non-core" precipitation (based on empirical rather than physical definitions) and assigns a rain rate that is a combination of the two depending on the spatial characteristics of the nearby cloud mass. Precipitation in the convective cores is related to T10.7 via an equation form is used that is similar to Eq. (1), since the original calibration of Vicente et al. (1998) focused on convective cores. However, instead of a fixed value for the multiplier (1.1183*1011) and the multiplicative adjustment to T in the exponential (-0.036382), these values are fit to a rain rate of 0.5 mm/h at 240°K and a rain rate at 210°K that is related to the GFS value of PW according to the three-segment function shown in Fig. 1(a). However, a maximum ceiling on rain rate is set as the precipitable water (in inches) multiplied by 40 mm/h, predicated on the idea that maximum rain rate should be a function of moisture availability. If the rain rate for the coldest nearby pixel (see below) would be higher than this theoretical maximum, then the rain rate curve coefficients are recomputed based on a rain rate of 0.5 mm/h at 240°K and of the theoretical maximum value at the lowest pixel temperature in the vicinity. Sample curves are shown in Fig. 1(b); for this example, the lowest pixel temperature in the vicinity is assumed to be 195°K for simplicity. Precipitable water is also used to make slight changes to the pixel brightness temperature prior to computing rainfall rate, as explained in Section c. 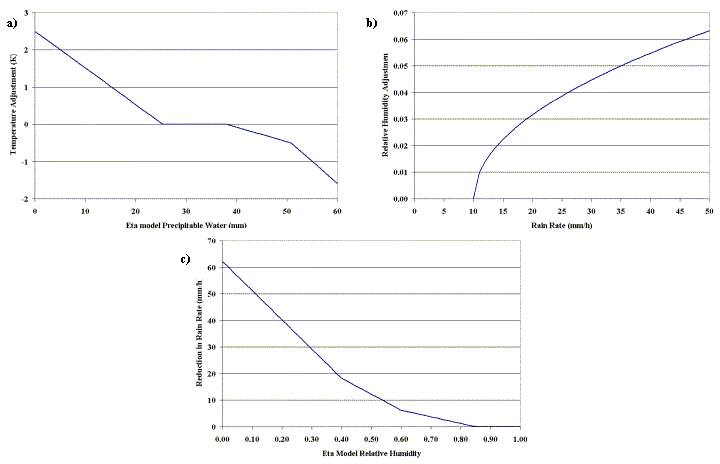
Figure 2. Additional HE adjustment functions: (a) brightness temperature adjustment (K) as a function of GFS model precipitable water (mm); (b) augmentation of GFS relative humidity as a function of HE rainfall rate (mm/h); and (c) reduction in HE rainfall rate (mm/h) as a function of adjusted GFS model relative humidity. For "non-core" precipitation, the maximum rain rate RRmax is also a (different) function of precipitable water, and the rain rate equation is a simple linear relationship to brightness temperature that is scaled by RRmax:
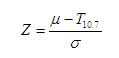
but is not allowed to exceed 20% of the corresponding convective rain rate or 12.0 mm/h, whichever is lower (Fig. 1c). Both the presence/absence of precipitation and its intensity are a function of the extent to which a particular pixel is "core" or "non- core". This in turn is based on the characteristics of the region surrounding the pixel of interest, which are determined in several steps, after initially eliminating pixels that are obviously too warm to produce significant precipitation. The first step involves finding the minimum temperature Tmin of a 101x101- pixel box centered on the pixel of interest. This minimum temperature is used to derive the radius of the actual region of interest. Lower values of Tmin imply a larger convective core and thus a larger area of interest (up to a 50-pixel radius for cloud tops at or below 200°K), while higher values imply a smaller area of interest (30 pixels for 220°K or higher). The second step is to determine the presence or absence of precipitation and the relative fraction of "core" and "non-core" precipitation for the pixel of interest based on how its temperature compares to its surroundings. This is done by computing the mean (μ) and standard deviation (σ) of T10.7 within the previously selected radius and comparing the pixel T10.7 to these values via the quantity.
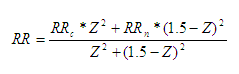
For negative values of Z (i.e. the pixel is warmer than the average of its surroundings) the rain rate is set to zero, under the assumption that such pixels are cirrus or otherwise convectively inactive cloud. For positive values of Z (which are constrained to be 1.5 or less), the "core" fraction is related to Z and the "non-core" fraction to (1.5-Z), such that the final rain rate RR can be computed from the "core" rate RRc and the "non- core" rate RRn as follows:
resulting in purely "core" rain for the coldest cloud tops (Z=1.5) and purely "non-core" for the warmest raining tops (at the average value such that Z=0), and a blend of the two for values in between. It should be noted that convective systems typically have multiple brightness temperature minima, and that a single radius is inappropriate for differentiating local from global minima. Consequently, this same computation of rain rate is performed for a smaller (15-pixel) radius, and the final rain rate is the square root of the product of the two rates. The exception to this is if the rain rate computed from the smaller radius is zero, in which case it is not considered in the final rain rate calculation. In addition to accounting for differences in precipitation mechanisms, this approach has the benefit of being more robust than the AE in differentiating (precipitating) cumulonimbus from thin, nonprecipitating cirrus. Both types of cloud can produce similar values of brightness temperature at a given pixel, so the AE, uses changes in brightness temperature between successive images to differentiate cumulonimbus (which should cool with time) from cirrus (which typically do not). However, temperature changes at a particular pixel due to cloud movement (advection) often mask the actual changes in a particular portion of the cloud, resulting in either the elimination of raining cumulonimbus or the retention of nonzero rates associated with cirrus. The former effect produces "holes" in the heavier rain areas in AE imagery when viewed up close. b. Moisture Availability and Subcloud Evaporation AdjustmentsIn the original AE, a moisture correction factor was used to adjust for the tendency of the AE to overestimate precipitation in wet regions and underestimate in dry regions (Vicente et al. 1998). This correction factor, as first proposed by Scofield (1987) consisted of the precipitable water (PW, in inches) multiplied by the relative humidity (RH, expressed as a decimal fraction) from the 500 hPa surface layer of the GFS model. The rainfall rates were multiplied by this PWRH correction factor (which is scaled from 0.0 to approximately 2.0), except for regions where T10.7 < 210°K, where only reduction of rainfall rates by the PWRH factor was permitted. Although the use of this parameter often successfully accounted for subcloud evaporation in regions where both PW and RH values were low, it exhibited a tendency to remove excessive amounts of precipitation in cases where PW was low but RH was high-an especially prominent problem during the cold season (and throughout the year in the Pacific Northwest). In such cases where PW values were less than one inch (25.4 mm), the PWRH factor would cause rainfall rates to be reduced even in a saturated atmosphere. A more physically realistic moisture correction was developed by applying the PW and RH corrections separately. The precipitable water has become a moisture availability factor, and the rainfall rate curve is now adjusted upward or downward based on the PW value (Section 2a). In addition, the brightness temperature values are adjusted according to the value of PW, resulting in slight increases (rain rate reductions) for dry environments, and decreases (rain rate enhancements) for higher-PW environments (Fig. 2a). Meanwhile, the RH factor has been modified from a multiplicative effect to a subtractive one, such that a fixed amount of precipitation is evaporated prior to reaching the ground, rather than removing a fraction of the falling precipitation. After first adjusting the GFS model RH slightly to account for falling rain (Fig. 2b), a subtraction from the rainfall rate is made based on the value of RH as depicted in Fig. 2c. c. Other Adjustment ParametersThe convective equilibrium adjustment that was incorporated into a later version of the AE (Scofield 2001) has also been incorporated into the HE. This adjustment was initially developed to enhance rainfall in regions where the convective equilibrium level (EL) was too low (in height) for very cold cloud tops to develop, but where very heavy precipitation is still possible. A modification of the IFFA adjustment of Scofield (1987), this adjustment uses GFS model temperature and dewpoint profiles to determine the convective equilibrium temperature of a particular pixel. If that value exceeds 213°K, a warm-top adjustment is performed whereby 90% of the difference between the actual equilibrium temperature and 213°K is subtracted from T10.7 (only for pixels that are warmer than the equilibrium level temperature) when computing the rainfall rate, with a cap of 25°K on the magnitude of the adjustment. The HE version of this correction adds information from the pixel surroundings. If the coldest cloud top within the region of interest is no more than 10°K colder than the equilibrium level (i.e. is reasonably consistent with the EL given the differences in scale between the GOES pixels and GFS grid spacing), then the minimum temperature within the region of interest is used instead of the pixel temperature to determine the EL adjustment. However, if the coldest cloud top within the region of interest is more than 10°K colder than the equilibrium level temperature, it is assumed that the GFS-derived equilibrium level temperature is too warm and the adjustment is weakened to 60% of the difference between the actual equilibrium temperature and 213°K, with a cap of 15°K. The adjustments for orography and parallax that are detailed in Vicente et al. (2002) have also been incorporated into the HE. The orography adjustment uses 850 hPa winds and topography from a digital elevation model at 4-km resolution (10-km outside the CONUS) to derive the vertical component of wind, as described in detail in Vicente et al. (2002). This vertical wind component is then scaled into a multiplicative adjustment to the rainfall rate. The parallax correction, described in detail in the same paper, adjusts the horizontal location of the satellite pixels prior to rain rate computation, based on the cloud height (estimated from T10.7 and the U.S. Standard Atmosphere) and satellite zenith angle. Finally, an adjustment for satellite zenith angle that was incorporated into a later version of the AE has also been used in the HE. Since the path length (and thus the atmospheric attenuation of radiation) increases with satellite zenith angle, excessively low values of T10.7 can occur near the edge of the satellite scan. This can result in substantial overestimation of precipitation rate, since the AE rainfall rate is highly sensitive to T10.7 at low temperatures. A technique developed by Joyce et al. (2001) uses the satellite zenith angle, T10.7, season, and latitude to correct for these effects. ReferencesJoyce, R., J. Janowiak, and G. Huffman, 2001: Latitudinally and seasonally dependent zenith-angle corrections for geostationary satellite IR brightness temperatures. J. Appl. Meteor., 40, 689-703. Scofield, R. A., 1987: The NESDIS operational convective precipitation technique. Mon. Wea. Rev., 115, 1773-1792. Scofield, R. A., 2001: Comments on "A quantitative assessment of the NESDIS Auto-Estimator." Wea. Forecasting, 16, 277-278. Vicente, G. A., J. C. Davenport, and R. A. Scofield, 2002: The role of orographic and parallax corrections on real time high resolution satellite rainfall estimation. Int. J. Remote Sens., 23, 221-230. Vicente, G. A., R. A. Scofield, and W. P. Menzel, 1998: The operational GOES infrared rainfall estimation technique. Bull. Amer. Meteor. Soc., 79, 1883-1898. |
|
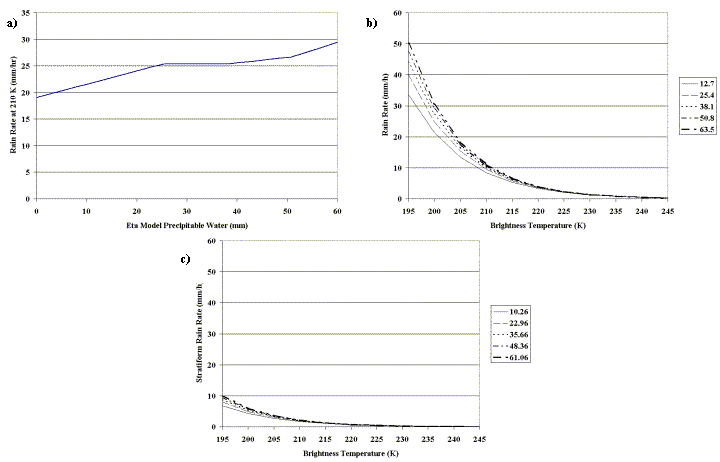 Figure 1. Adjustment functions used in the Hydro-Estimator: (a) rainfall rate at 210K (mm/h) as a function of GFS model precipitable water (mm) that is used to produce the brightness temperature-rainfall rate relationship; (b) the brightness temperature-rainfall rate relationship for various values of precipitable water (mm) for "convective core" precipitation; and (c) the corresponding relationship for "non-core" precipitation. The legend in (b) and (c) indicates the value of precipitable water corresponding to each curve.