Blended Rain Rate - Algorithm DescriptionThere are six steps in the production of the blended rain rate product: (1) ingest the data from PDA, (2) compile 5-day histograms of rain rate for each satellite, (3) read each orbit of data and apply the histogram correction, (4) map the corrected data, (5) composite the maps, and (6) write out the output files. These steps are detailed in the next 6 sections. All of the processing described here is performed in DPEAS, the Data Processing and Error Analysis System (Jones and Vonder Haar 2002). 1. Data IngestThe first step is to read the input files (acquired from DDS), which come in HDF-EOS Swath format. We make several changes to the files to make them consistent regardless of the source of the files (NESDIS, FNMOC, etc.).
These changes are minor, but they make processing, especially mapping, easier. A new file in HDF-EOS Swath format is written for each input file. 2. Histogram ConstructionRetrievals of the same quantity (rain rate, in this case) from different satellite instruments using different retrieval algorithms can be expected to produce slightly different results. Kidder and Jones (2007) discussed a technique to "blend" total precipitable water values from different satellites using histogram adjustment. We have modified the Kidder and Jones technique for use in blending rain rate retrievals. The heart of the technique is a histogram constructed for each satellite instrument. Each histogram contains five days of data. At NESDIS operation, we construct the histograms twice per day. They can be constructed as often as one likes, but each time they are constructed, five days of global data for each instrument must be read. Land and ocean (water) histograms are kept separately. The histogram is simply the number of rain rate observations in each of 201 bins (numbered 0 to 200). The first bin (bin 0) is zero rain rate (not raining). The second bin (bin 1) is >0 to 0.25 mm/hr rain rate. The third bin (bin 2) is >0.25 to 0.50 mm/hr. The 201st bin (bin 200) is >49.75 to 50.00 mm/hr. Both the number of bins and the bin width are adjustable to accommodate future instruments and needs. The histograms are written to text files for use in the histogram correction algorithm. 3. The Histogram Correction Algorithm
3.1 Background For Total Precipitable Water, we construct a histogram for each scan position in a scan line because one can expect some differences along the scan line (see Blended TPW Products Version 2.0: Algorithm Theoretical Basis Document). We do not do this for rain rate. All scan positions are kept in a single histogram. The difference is that only a small fraction of scan spots have rain whereas every scan spot has a TPW value. It is thought that the full rain rate distribution is not adequately observed at each scan position, so we pool all the scan positions together. We could use a time period longer than five days, but this would be computationally burdensome. We chose instead to sacrifice the ability to correct each scan position to keep the histogram period the same as for TPW (five days).
3.2 Construction of the Correction The first step in constructing the correction for a particular swath file is to read the latest five-day histograms from the instrument which made the observations in the file being processed and from the reference instrument. The cumulative probability distribution function is then calculated for both five-day histograms 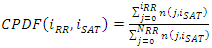 Where n(j, iSAT) is the number of observations in the jth rain rate bin for satellite iSAT. Note that before we calculate CPDF, we set n(0, iSAT) = 0; that is, we count only raining pixels. Therefore, CPDF(0, iSAT) ≡ 0. The physical interpretation of CPDF is that it is the fraction of raining pixels with rain rate less than or equal to 0.25 iRR.(Recall that 0.25 mm/hr is the width of the rain rate bins in the histogram).
3.3 Application of the Correction 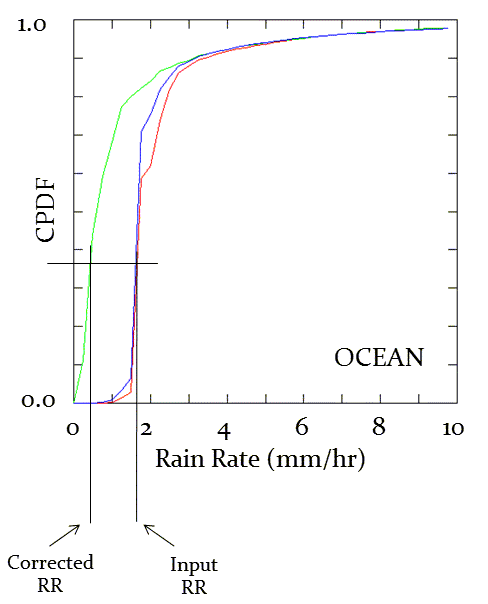 Figure 3 1. Illustration of the histogram correction technique. The land correction works the same way, but uses the land CPDF tables. Different reference satellites can be used for land and ocean. The reference satellite can be selected in the script file. The current operation is set to use S-NPP as the reference satellite, and will be updated to use NOAA-20 soon. Note that before it died, we captured a CPDF from the SSMI on DMSP F13. It is a static CPDF, obviously, but it can be selected as the reference satellite if so desired. There are three "strength of correction" options, selectable in the script file:
Typically, NESDIS uses no correction over land and light correction over the ocean. After all of the pixels in the input file have been corrected, the file can be written to disk, or it can be retained in memory for further processing (i.e., mapping). 4. MappingOnce the data have been "corrected," they need to be mapped for analysis. The base map was chosen to be compatible with a map used at SAB. It is a Mercator projection with 16 km resolution at the equator. The map is centered at the equator and 160° West. It has 1437 rows and 2500 columns. The upper left pixel is at 71° 14' 52" North, 20° 20' 38" East, and the lower right pixel is at 71° 14' 52" South, 19° 35' 3" East. The cut line is at 20° East, which was chosen to emphasize ocean areas. The map projection routines are part of the HDF-EOS libraries in DPEAS. This map is identical to that used for Blended TPW, as is the DPEAS routine used to do the mapping. The rain rate data are in files which represent approximately one orbit. Before mapping, the rain rate value for each scan spot is adjusted with the blending algorithm described in Section 3.3. Then each scan spot is mapped by filling a quadrilateral that represents the scan spot. (Actually, the scan spots overlap somewhat, but the overlap is ignored.) The SSM/I quadrilaterals are 25 x 25 km, the SSM/IS quadrilaterals are about 18 x 18 km and the AMSU-B quadrilaterals are 16 x 16 km at nadir and approximately 26 x 49 km at the edges of the scan. The quadrilaterals are determined by interpolation and extrapolation from the latitudes and longitudes of the center points of the scan spots, which are contained in the input HDF-EOS files. The quadrilaterals are contiguous both along the scan lines and from scan line to scan line. Thus, the resulting map has no holes within the scanned area. (However, because the microwave swaths do not overlap near the equator, there are gaps between adjacent swaths). In addition to mapping the rain rate value, the time that the scan spot was observed and the satellite which observed it are also mapped. When the single orbits are composited (see next section) these additional mapped values are available to help interpret the data. The intermediate output file from the mapping step is an HDF-EOS Grid file, which is mostly blank, because it covers most of the Earth, but contains only one orbit of data. 5. CompositingEach orbit of data is corrected and mapped once, then used without reprocessing in as many composites as desired. A 10-h composite is made each hour, which includes approximately 7 x nsat orbits, where nsat is the number of satellites used in the composite. Approximately one "new" orbit for each satellite is found. The remaining 6 x nsat orbits (approximately) are accessed from disk files and composited again, which results in a considerable savings in computer processing. Satellite data may be composited or blended in a variety of ways depending on the intended use of the blended product. For Blended Rain Rate, the only way we composite the data is to use the most recent observation at each point. Other compositing schemes (such as the "average" composite) cause moving storms to appear more than once and at reduced intensity. The DPEAS compositing routine used for Blended Rain Rate is identical with the compositing routine used for Blended TPW. 6. The Output FileThe output files contain an HDF-EOS Grid file with rain rate, time of observation, and satellite identifier at each grid point, and also a McIDAS Area file containing the same information. As June of 2019, a new netCDF file with Cylindrical map projection is added and made available to users. |
Product MonitoringProcess Monitoring |